Tyler Durden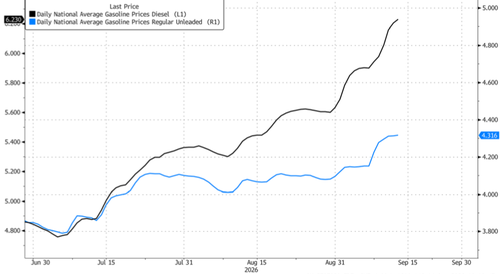
Here’s What’s Happening Inside Convenience Stores As Gas And Diesel Spike
We continue to track convenience store trends as an indicator of working-class sentiment, building on our coverage of the spending pullback that emerged early in the US-Iran conflict. That weakness persisted into late summer as August’s fuel-price spike put further pressure on household budgets.
The Gulf conflict and a global refining squeeze pushed regular gasoline above $4.50 a gallon and diesel above $5.50 in August, leaving consumers with less room for discretionary purchases.
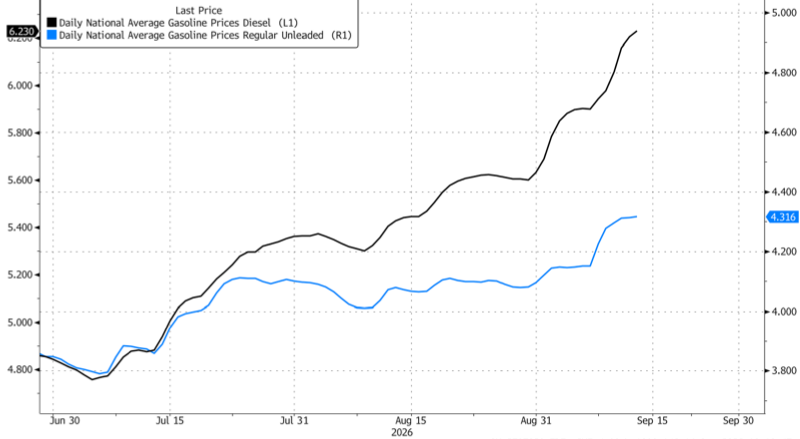
Jefferies food analyst Scott Marks published a note on Monday morning providing new insight into consumer trends at the convenience store level in August, as elevated fuel prices appeared to renew pressure on consumers.
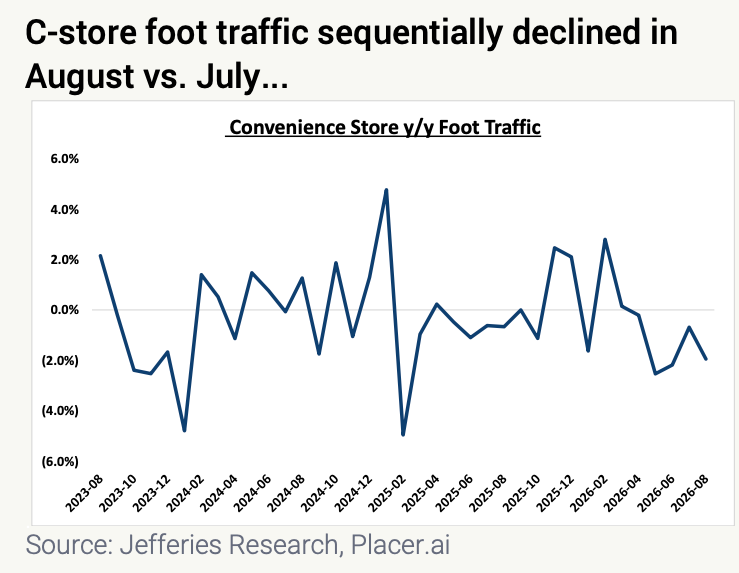
Marks and his team found that visits fell 2% from a year earlier, a 1.25-percentage-point deterioration in the annual growth rate compared with July. The reversal largely erased July’s improvement, he said, adding that higher fuel prices in late August and early September suggest traffic could remain under pressure.
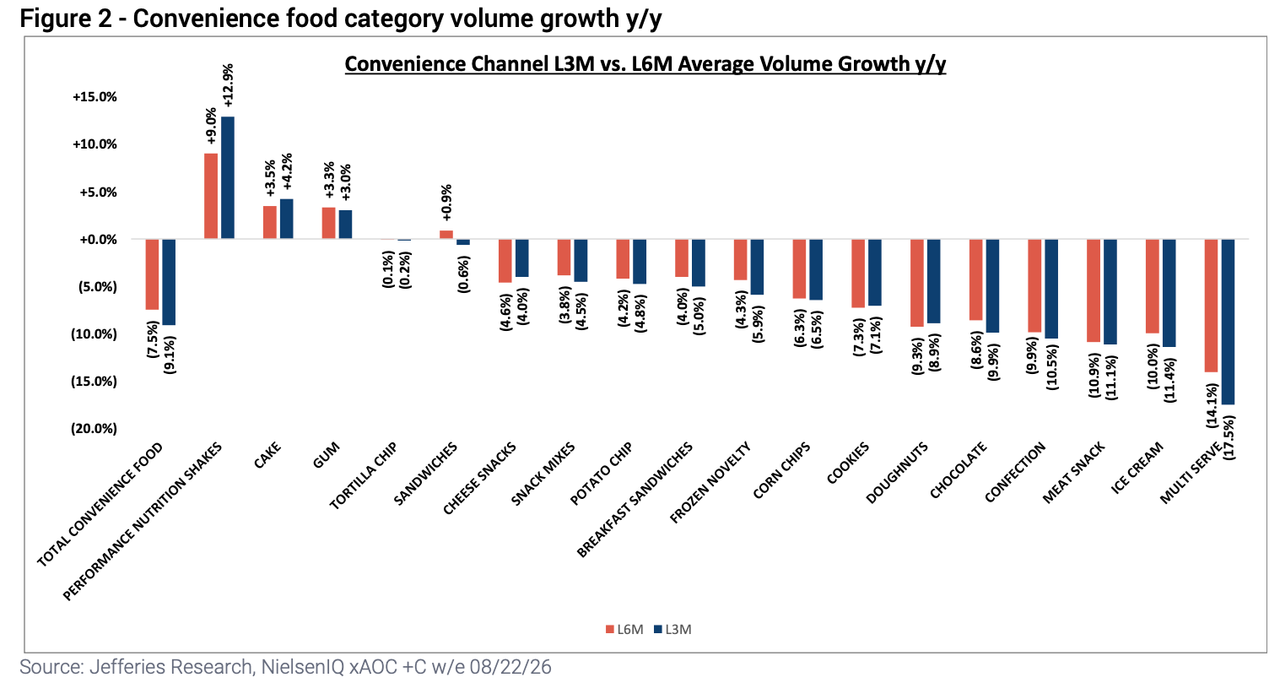
The squeeze is showing up both at the pump and inside the store. Across tracked convenience store food categories, volumes declined roughly 9% from a year earlier during the three months ended Aug. 22, compared with a 7.5% decline over the six-month period. Dollar sales fell about 3%, even as pricing growth accelerated to approximately 6% from 5%.
Marks added more color:
What We C: Traffic Takes a Step Back in August
Convenience store traffic stepped back down in August, with rising fuel prices appearing to renew pressure on the consumer. A vast majority of top food categories saw sales worsen L3M vs. L6M, with volume trends similarly worsening in most. Performance nutrition shakes were the clear standout on strong DD% growth, underscoring consumer demand for protein, while chocolate inflected negative and energy continues to lead in beverages.
Convenience channel traffic steps back down. C-store foot traffic fell ~2% y/y in August, representing a 125 bps sequential decline vs. July. This decline follows a 150 bps sequential improvement in July, with rising fuel prices in the back half of the month that remained elevated through August likely driving the reversal in trends. Notably, with fuel prices rising further in late August and early September, c-store traffic is likely to remain under pressure. Nielsen data showed broad-based softening across top food categories, with a majority experiencing weaker sales trends in the L3M versus L6M period. Volumes also deteriorated across most categories, while pricing accelerated in the majority.
CASY results underscore trade-down, low-end more pressured. CASY FQ1 pointed to a consumer still spending on food/bevs while trading down elsewhere, with inside comps +3.2% and PFDB +4.8% driven by traffic and units. All income cohorts grew, though lower-income shoppers were more pressured, and higher fuel prices drove fewer gallons per trip but more trips. Grocery softness was category-led, as national brand pricing pushed snack buyers into private label and beer stayed weak, while nicotine alts and energy outperformed. With expectations elevated into the print, shares traded off on multiple compression rather than deteriorating fundamentals.
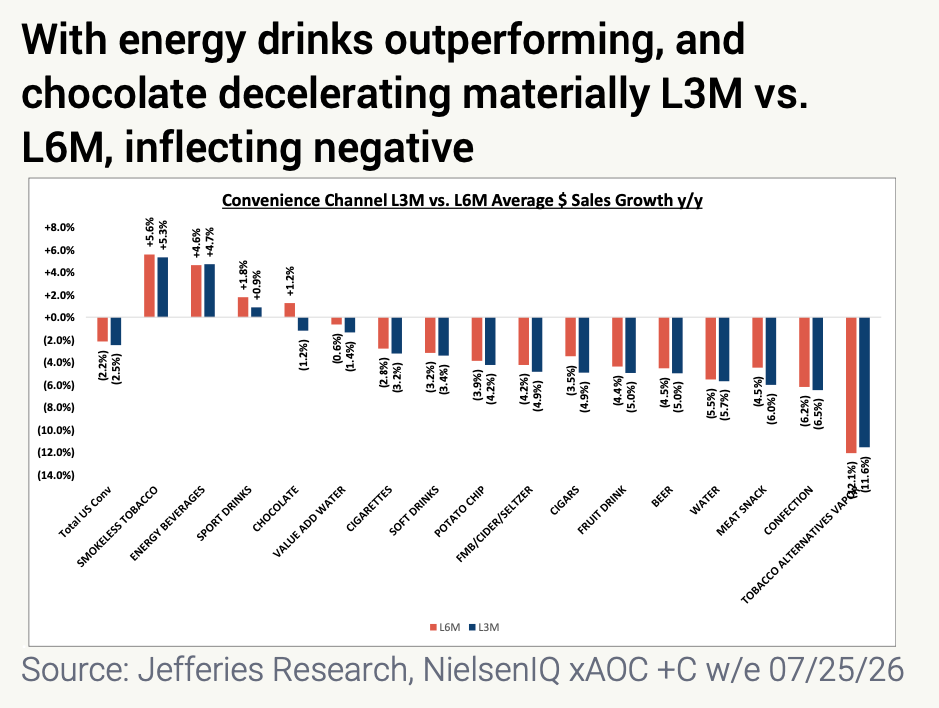
Performance nutrition shakes lead as chocolate inflects negative. U.S. tracked channel convenience store sales and volume trends deteriorated in the L3M vs. L6M ending Aug. 22, with total convenience volumes worsening to down ~9% from ~7.5% and sales worsening to down ~3% from ~2.7%. Performance nutrition shakes were the clear standout, with sales up ~13.5% L3M (vs. ~9% L6M) on ~13% volume growth and ~15% TDP growth, underscoring consumer demand for protein. Chocolate inflected negative on sales (down ~1% L3M vs. up ~1% L6M) as volumes worsened to down ~10% from ~8.5%. Multi serve (down ~17.5%), ice cream (down ~11.5%), meat snacks (down ~11%) and confection (down ~10.5%) led volume declines, with multi serve, frozen novelty, and sandwiches deteriorating most sharply L3M vs. L6M. On a sales basis, multi serve (down ~12.5%), confection (down ~6.5%), doughnuts (down ~6%) and meat snacks (down ~6%) were the steepest decliners. Price realization remained positive for most categories, led by chocolate (+8.5%), with total convenience food pricing accelerating to +6% L3M from +5% L6M.
Energy Remains a Standout in Beverages. Non-Alc Beverages declined 0.5% y/y over the L3M (-0.2% L6M) in the convenience channel, while Energy’s outperformance continues, up 4.7%. Pricing is sticking, innovation is working, and new consumers are entering the category as consumers prioritize functional beverages. Meanwhile, soft drinks declined on both a dollar (down 3.4%) and a volume basis (units down 7.5%) over the L3M. Beer did, too, with sales down 5.0% L3M.
The report draws on Placer.AI foot-traffic data and NielsenIQ data from major convenience store chains and fuel retailers, including 7-Eleven, Casey’s, Circle K, QuikTrip, Royal Farms and Wawa, providing a broad view of spending behavior across the channel.
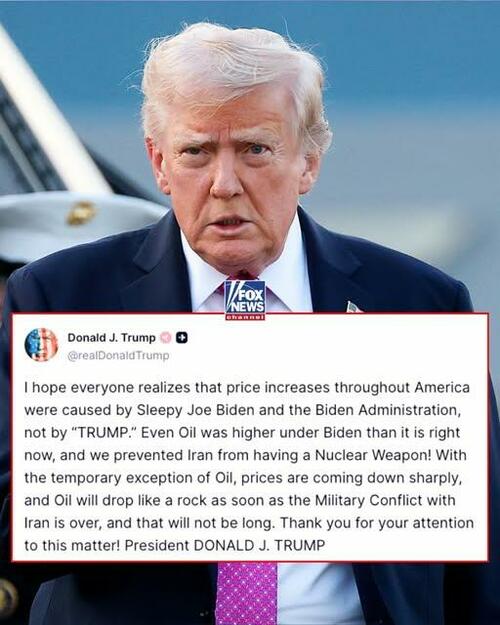
Marks’ findings suggest consumers are becoming more defensive with their spending, trading down and reducing purchase volumes as fuel and food costs squeeze household budgets. Strength in select categories shows that consumers remain willing to spend. This consumer pressure story at the convenience store level doesn’t bode well for the Trump administration ahead of the midterm elections, as folks usually vote with their pocketbooks.
Professional subscribers can read more about consumer trends here at our new Marketdesk.ai portal.
Tyler Durden
Mon, 09/14/2026 – 15:05
ZeroHedge News
[crypto-donation-box type=”tabular” show-coin=”all”]