Tyler Durden
This Time Is Different? Earnings & Price Break 90-Year Trends
Authored by Lance Roberts via RealInvestmentAdvice.com,
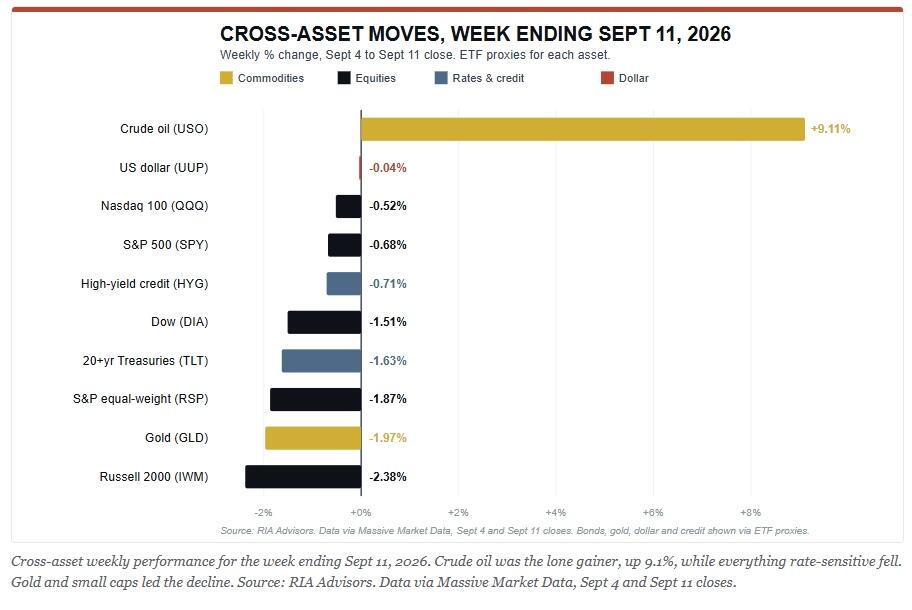
September, so far, is living up to its reputation. The market slipped to the 50-day moving average, with the tape taking orders from crude oil. For the week, crude rose about 9% over four sessions, which pulled the 10-year Treasury yield higher right along with it, closing just under 5%. The corners of the market that hate higher rates slid while the S&P 500 dipped 0.68% to close the week at 7,666. However, that rather lackluster headline conveniently hides the real story beneath it.
Take a look at the spread between markets. Small caps fell 2.38% while the Dow dropped 1.51%. The equal-weight S&P index gave up 1.87% while the cap-weighted index, by contrast, lost less than a point. The Nasdaq-100 barely budged, declining just 0.52%. When the average stock falls three times as hard as the index, leadership is narrowing, not broadening. As we have flagged in recent notes on the AI complex, a market carried by a handful of names runs with a thin margin for error.
Of course, the big news this week was the inflation data, which gave the bond market the excuse it needed. Headline CPI ran at 3.4% over the past year, and remains sticky, while core CPI remained at 2.4%, just above the Fed’s target.
On the producer price side, inflation told a louder story, with PPI jumping 0.4% on the month and the annual rate accelerating to 5.4% from 4.8%. However, that number, while higher than expected, will be revised lower with the benchmark revisions at the end of the month.
Overall, it was goods pricing that did the damage, which rose 1.1%, with diesel alone leaping 24%. Even core producer prices printed at 4.6%. However, while the bond market was jolted, the reality is that this was an oil shock rather than a sign of an overheating economy. The former doesn’t justify a Fed rate hike; the latter would. Neither report was a disaster, but neither one gives the Fed a clean reason to hike rates.
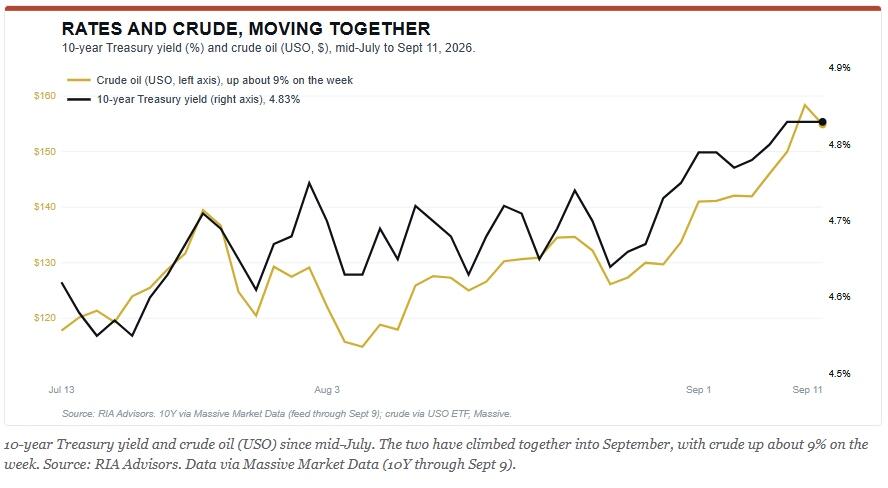
On a cross-asset review, the moves fit a “rate scare.” Gold fell, the dollar remained flat, and volatility lifted off its lows without anything close to panic. However, the real story remained below the surface in the cyclical and rate-sensitive groups, which dragged lower all week.
The Fed meets Tuesday and Wednesday next week, with the market still leaning toward a quarter-point hike. Firm headline inflation and a crude oil spike are not the backdrop a central bank is likely to hike into, particularly with a softening labor market.
Watch the long end into the decision. If oil keeps running and the 10-year pushes above 5%, the multiple on this market gets much harder to defend. The narrow leadership that propped everything up all summer would be the first thing to give way, which wouldn’t be a surprising outcome for the month of September heading into the midterm election cycle.
💰 This Time Is Different?
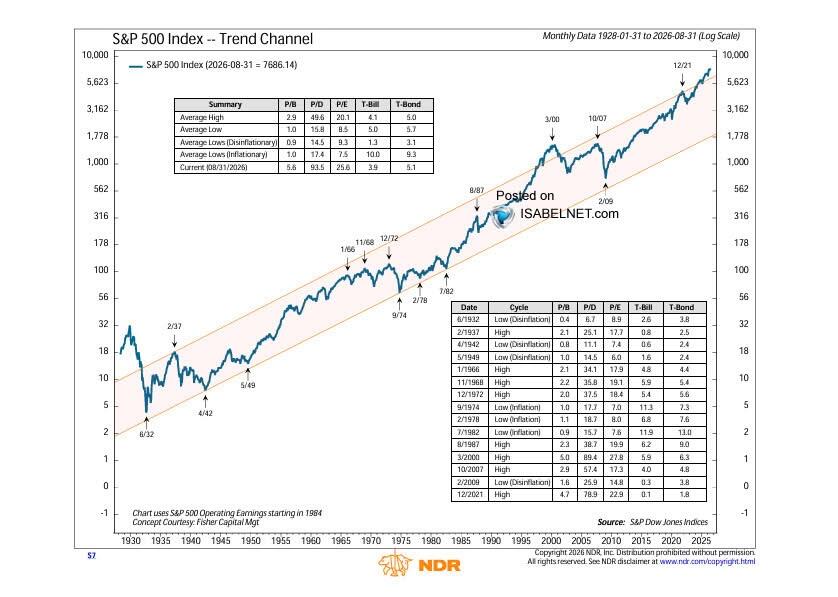
For every secular bull market, there is an eventual secular bear market. The next leg of the full-market cycle inevitably begins where everyone believes “this time is different.” There were two important charts this past week that should at least lend a momentary pause. The first was from Ned Davis Research, showing the market (on a log scale) is now trading above the upper limit of its long-term trend. The previous extreme was in early 2000, for reference.
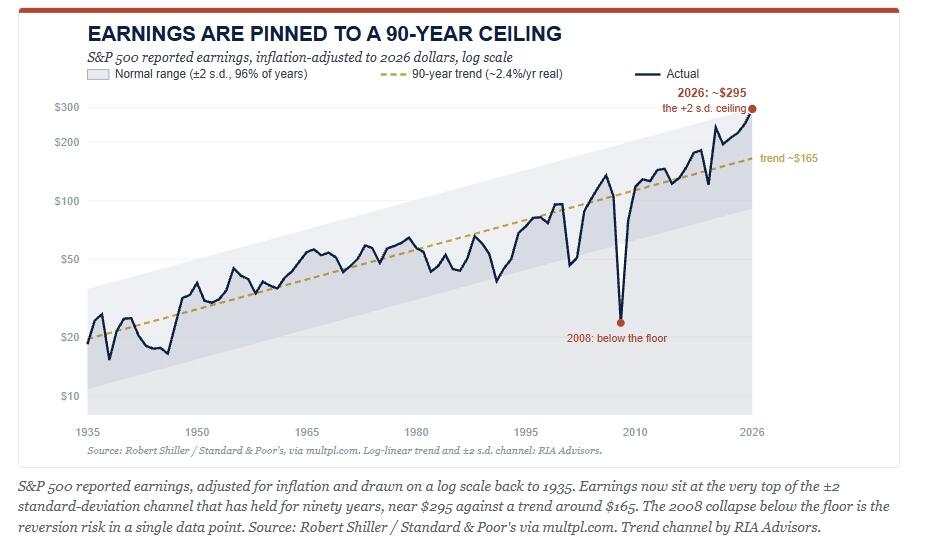
Secondly, corporate earnings just broke above a trend that had contained them for more than 90 years.
Currently, it is not surprising that, given the advancement of AI, surging earnings growth, and bullish markets, investors inevitably come to believe that “this time is different.” The question we want to explore today is “Is it really different this time,” or just a normal secular cycle playing out in real time?
Earlier this month, I argued the AI bears are right about the excess but may be wrong on the trade. So let’s put the bull case on trial and see what holds.
What’s Actually Driving The Breakout
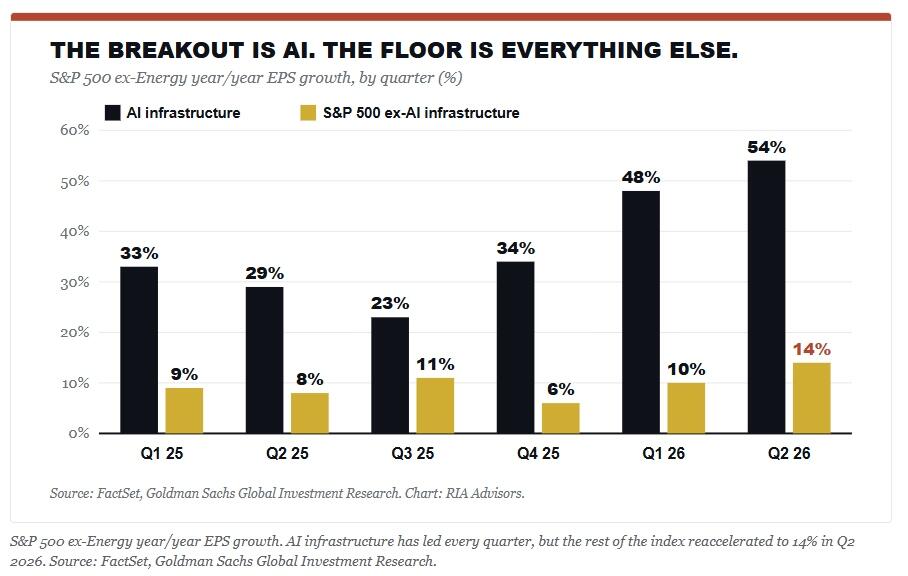
Let’s start with the good news, because there is plenty of it. Second-quarter S&P 500 earnings grew roughly 31% year over year on an adjusted basis, well ahead of the 23% the Street had penciled in before the season. Bloomberg calls it the strongest non-recession-recovery profit growth in its data going back to 1992. AI infrastructure did most of the heavy lifting. By BlackRock’s math, AI-related names drove close to 60% of the index’s earnings growth, and three hyperscalers account for roughly 70% of what analysts expect for the full year.ar.
Yes, there are reasons to be skeptical of the earnings growth, such as one-time investment gains that are boosting the numbers. However, there is a part that the bears keep glossing over. The rest of the index is finally pulling its weight as well. When you strip out energy, and the AI build, and the other roughly 490 companies still grew earnings 14% in the second quarter, a number that would headline most years on its own. The “broadening” everyone keeps asking for is finally showing up in the profit data itself, not the hope column.
This rally is earnings-led, not multiple-led, and that single fact is what separates it from 2000. Look at the revisions. Forward earnings estimates have climbed for most of the year, while the forward multiple has drifted lower. Price has been chasing profits, not the other way around. Hyperscaler capital spending is running north of $700 billion this year, up more than 80%, funded out of cash flow rather than junk debt. Furthermore, the hyperscaler capex is REAL. The question was never whether the spending exists. The question is what you pay to own the earnings it produces.
The Pain Trade Still Points Higher
However, the real risk to the bear case lies in the sentiment. You have a market compounding 30% earnings growth, and investors are positioned as if a recession just started. Sentiment across both the AAII survey and Goldman’s own indicator sits firmly bearish. Nasdaq-100 short interest is up 35% since June. A sharp third-quarter de-grossing has pushed fundamental long/short net leverage into the 6th percentile of the past year, gross tech exposure sits in the 43rd percentile, and roughly $163 billion in cash is parked on the sidelines waiting for a pullback that refuses to arrive.
Of course, the obvious is: “If everyone is already bearish, isn’t that itself the bullish tell?” The answer to that is “mostly, yes.” Strong earnings, light positioning, elevated shorts, and a mountain of idle cash are the exact ingredients of a “pain trade” that grinds higher and forces the underinvested to chase. Such is the setup that keeps me long into the highs even while I distrust them.
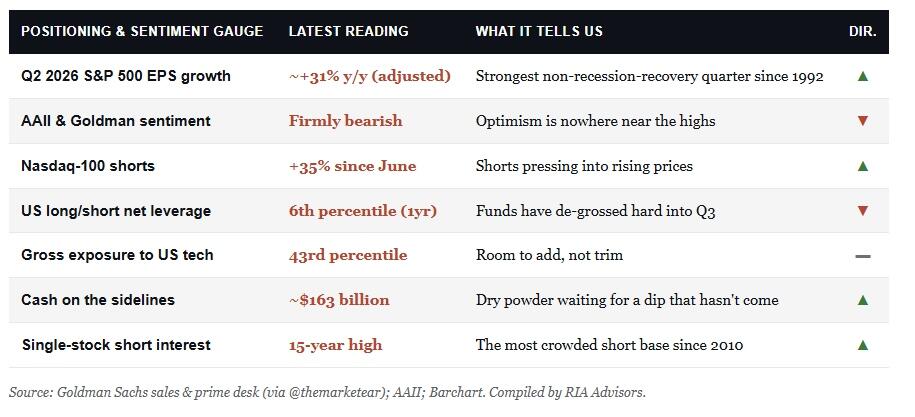
A good example is that single-stock short interest just hit its highest level in more than fifteen years. Every one of those shorts is a future buyer the moment the tape refuses to break. That’s fuel, not a warning, at least for now. The warning is in the next section.
The Asterisk On “This Time Is Different”
Here’s the problem with the clean bull story. The multiple only looks reasonable because it’s sitting on peak earnings. The S&P trades near 25.6 times trailing profits. That runs above the long-run average, and it runs above the typical reading at prior bull-market peaks. The Shiller CAPE just hit 41, its 96th percentile since 1980, a zone AQR ties to something like 3.9% annual returns over the next decade.
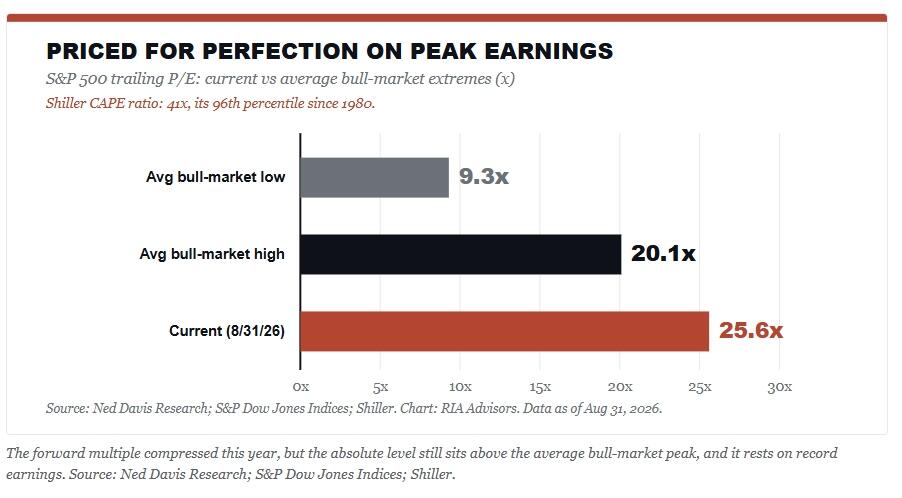
While there is a lot of focus on the market price, the risk was never really the “P.” It’s the “E.” When earnings break above a trend that held for ninety years, they are, by definition, above trend. And above-trend things are the things that mean-revert. A “reasonable” forward multiple computed on earnings that later prove to be a cycle peak is one of the oldest traps in the book. Such is the quiet danger in every “this time is different” market: the story is usually true right up until the math stops cooperating.

How These Breakouts Usually End
As we have discussed previously, Bob Farrell’s Rule #4 has aged well for a reason. “Exponential moves,” he wrote, “usually go further than you think, but they do not correct by going sideways.” That’s the uncomfortable geometry of a breakout above a nine-decade trend. It can extend beyond the skeptics’ ability to stay solvent, and it can still end with a snap rather than a slow drift back. Both things are true at once.
So, in my view, there are only two ways this will eventually resolve, and the market is currently pricing the first option with near 100% certainty.
- Either AI capital spending converts into durable returns and record margins hold, in which case earnings grow into the price, and the bull runs on. Or,
- Capex depreciation starts hitting the income statement, AI demand hits an air pocket, margins normalize, and profits fall back toward the trend they just escaped.
Here is the most important point. Whatever event causes the “E” to revert towards its long-term mean, the “P” will be repriced lower. I laid out the arithmetic of that second path in Why Crashes, Timing and Valuations Still Matter, and the math is unforgiving.
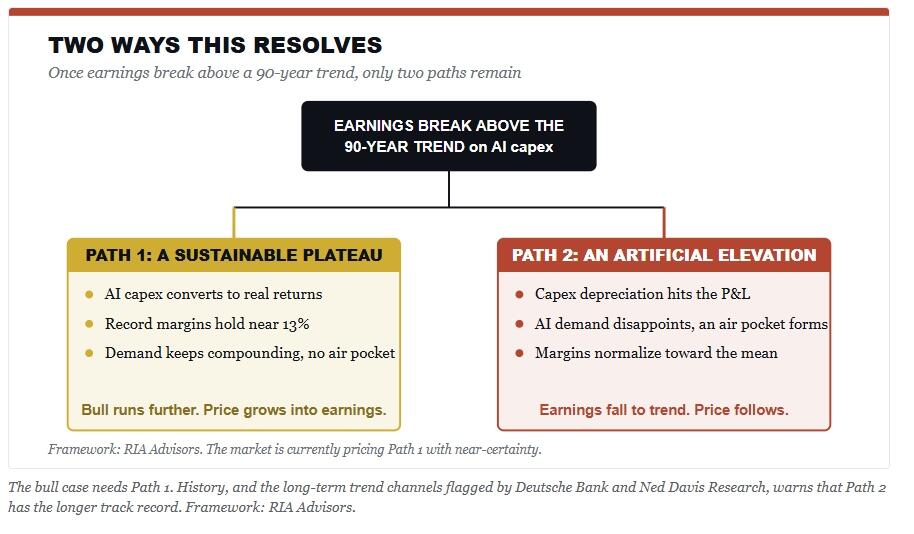
Nothing about a valid breakout tells you which path you’re on until you’re well down it. That’s precisely why you don’t have to pick. You participate in the move while it runs, and you pre-commit to the exit before it ends.
What Next?
I will tell you one thing: you have to give the bulls their credit. This past week was the perfect setup for a sharp sell-off in the market. Corporate buybacks are sidelined, interest rates spiked, and oil surged, pushing inflation higher. If there was ever a case for a pullback, it was this past week. Nonetheless, the correction that we have discussed over the last two weeks stopped right where the first line of support sits. The S&P 500 closed the week at 7,666, down 0.68%. The part that matters happened on Thursday, with the index trading down to 7,595 and closing dead on its 50-day moving average near 7,600. That was our initial downside target, and the market met it up to that point before Friday’s bounce lifted the price back above the line.
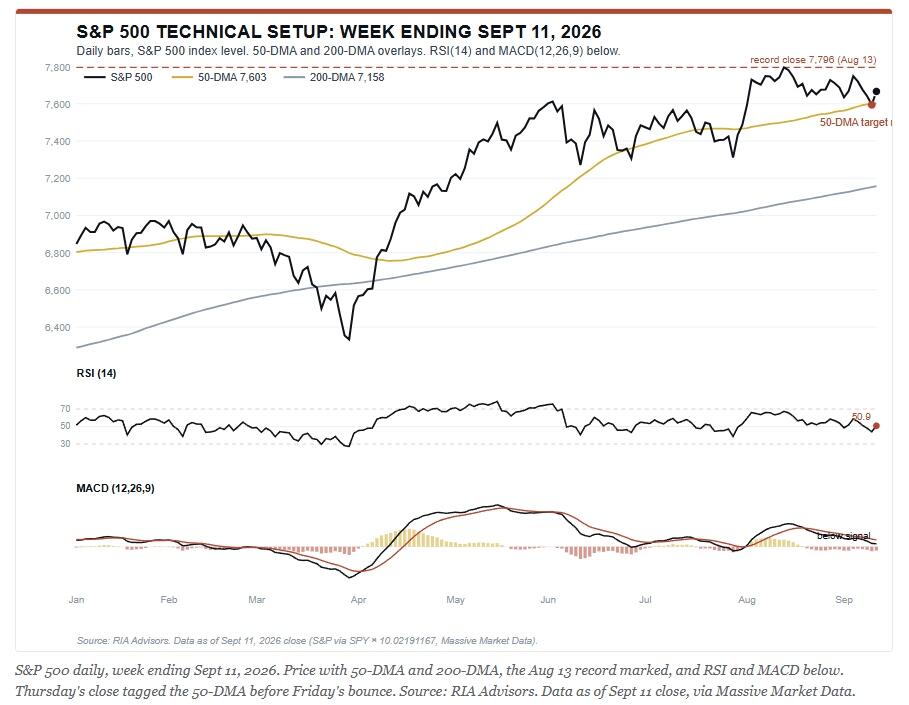
While the 50-DMA held on the first test, overall momentum remains another matter. RSI sits at 50.9, dead neutral, down from the high-50s a week ago. The MACD signal has crossed below its signal line, keeping downward pressure in place into the end of the quarter. Furthermore, the histogram has turned negative, adding to our caution. While the market held support, it did so with weakening momentum, which is the definition of an undecided tape.
From our vantage point, the breadth story is the bigger worry. The equal-weight S&P fell almost three times as hard as the cap-weighted index this past week. Most notably, it was small caps that led the whole thing lower, with volume telling the same story. Of course, the spike in crude oil didn’t help and forced the heaviest selling in the rate-sensitive names, rather than the index leaders. As noted, breadth is the key to a sustainable bull market rally. The current breadth is a warning, but not yet a sell signal.
This coming week keeps our focus on risk management. From that standpoint, we continue to recommend trimming the most extended winners back toward model weight into any push toward the old highs, rather than chasing them. The 50-DMA near 7,600 is the support line that decides our next moves. If we hold it, and the uptrend off the spring lows stays intact, we can keep exposures near normal levels. However, if we lose that support on a closing basis, the next real floor sits much lower at the 200-DMA near 7,158. We suggest keeping some dry powder heading into the Fed rate decision and next Friday’s option expiration.
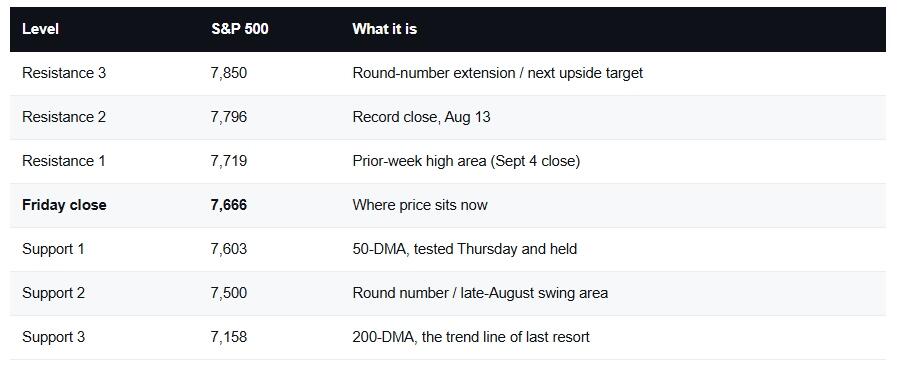
Heading into the end of the month and the quarter, there is one level that dictates portfolio strategy into October. A weekly close back above 7,796, the August record, says the buyers have reclaimed control. A close below 7,600 signals that the 50-DMA has failed and that the market wants deeper support. Everything in between is noise. And next week brings two catalysts big enough to force the break. Trade the level, not the narrative.
🔑 Key Catalysts Next Week
As mentioned throughout the commentary so far, there are two key events next week, and both are large enough to set the tone for the quarter. More importantly, they land 48 hours apart.
The first is the Fed. The FOMC meets Tuesday and Wednesday. The decision, a fresh set of projections, and Warsh’s press conference all hit on Wednesday afternoon. The market still leans toward a rate hike. However, as noted above, I think this week’s data made the call harder, not easier. A central bank does not like hiking into a 3.4% headline inflation print that was primarily a function of a temporary crude spike, so the real story on Wednesday may be who dissented, rather than the lack of a rate hike.
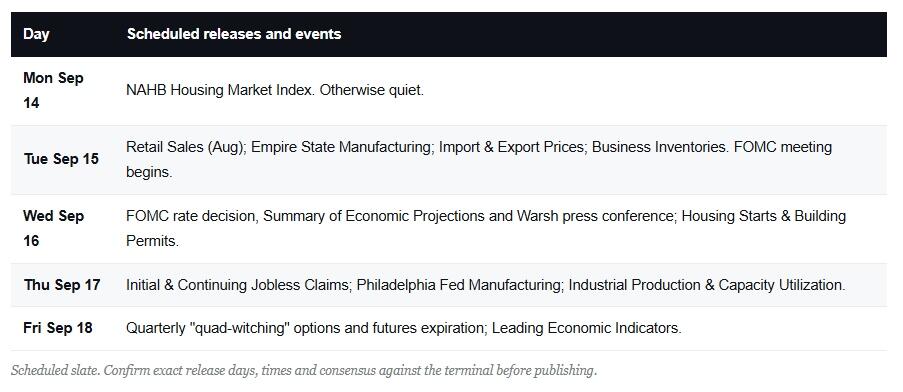
The second catalyst is purely mechanical. Next Friday brings the options and futures expiration, known as “quad-witching,” which occurs four times a year. Notably, this one is set up to be a record in size, which is unsurprising given the surge in options trading in the markets over the last couple of years. However, historically, expirations this large can pin price to the big strikes. Then they release it hard once they clear. Layer that on a Fed decision 48 hours earlier, and the week has a real setup for an outsized move.
The economic calendar around the Fed is full. Retail sales, industrial production, housing starts, the regional Fed surveys, and weekly jobless claims all print across the week. Retail sales carry the most weight. Consumer resilience is the last leg holding the soft-landing story together. A soft print would land badly, coming the morning after the Fed. There are no Fed speakers on the slate. The pre-meeting blackout window sees to that.
Earnings are thin in the gap between quarters, which gives macroeconomic data much greater weight. FedEx is the marquee large-cap report, worth a look as a read on shipping demand and the industrial economy on Friday.
The asymmetric risk is a hawkish surprise from the Fed. Whether the market is priced for a hike remains to be seen. However, if Warsh delivers a hike, the rate-sensitive trade may have already priced it in, along with the bond market. In other words, a rate hike might turn out to be a relief for bond traders after all.
What Should Investors Do Now
So, what does all this mean for your portfolio heading into next week? Mostly, nothing. However, over the longer-term time frame (next few quarters to a couple of years), this is where the two halves of the argument stop fighting and start cooperating. Is “this time different?” Most likely not.
First, the near-term evidence remains bullish. Both momentum and washed-out positioning suggest that investors remain invested for now. However, the longer-term evidence, including price action, stretched valuations, and above-trend earnings, clearly suggests that stronger risk management protocols should be implemented.
The reality is that you can hold both views without contradiction, and from our view, you should.
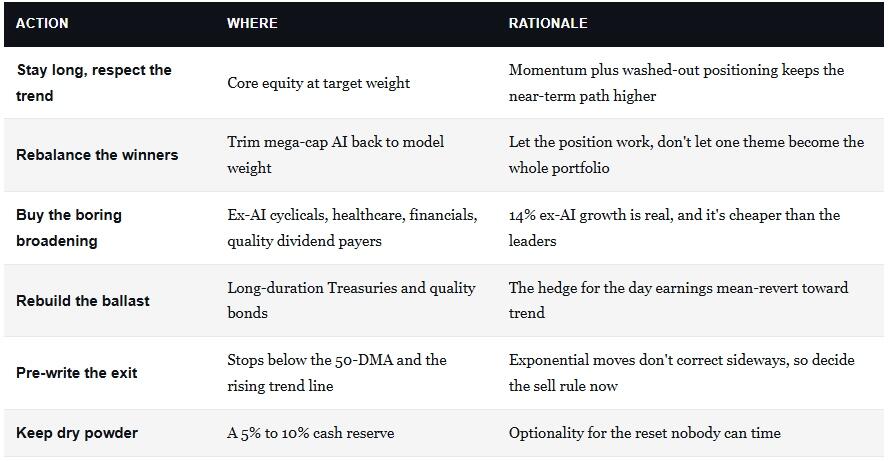
It isn’t a difficult plan to implement; it just requires a willingness to potentially give up some gains if that market moves higher near term, which is likely. Ride the trend, harvest the winners back to weight, spread into the parts of the market that are cheaper and finally growing, keep real ballast in bonds and cash, and write down your sell discipline today while your head is clear, rather than in the middle of the reset.
Will that keep you from giving back some of the last leg of the move? Yes. Will it keep you from riding a ninety-year breakout all the way back into the channel it came from? Also yes. I’ll take that trade.
The trend is your friend, right up until the bend at the very end. Position for the friend. Prepare for the bend.
Tyler Durden
Sat, 09/12/2026 – 12:50
ZeroHedge News
[crypto-donation-box type=”tabular” show-coin=”all”]