Bitcoin price slid early in the session, briefly falling to about $108,000 before recovering to $111,000.
The drop fueled roughly $825M in liquidations over the past day, with about $653M tied to long positions.
The market is now watching whether Bitcoin can push back into the $113,000–$115,000 range. Traders see this band as a key barrier. A move above it could pave the way for $120,000.
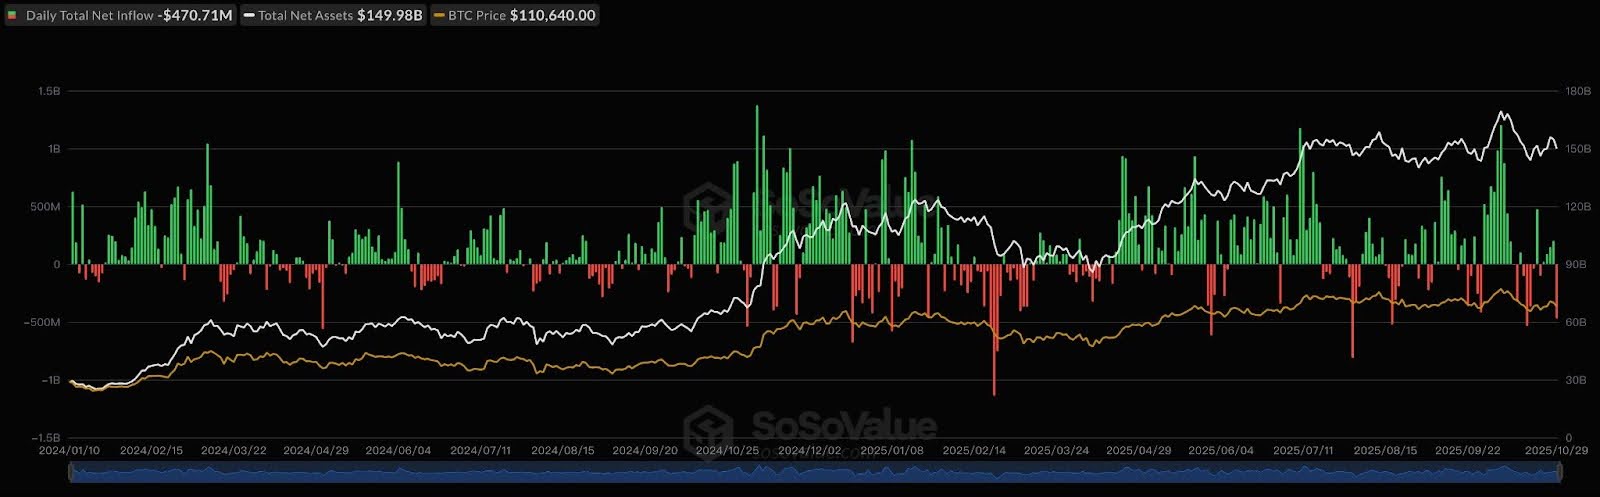
WuBlockchain reported that Spot Bitcoin ETFs saw about $471 M in net outflows on October 29.
On October 29 (ET), spot Bitcoin ETFs recorded total net outflows of $471 million, with no inflows across all 12 ETFs. Spot Ethereum ETFs saw total net outflows of $81.44 million, with BlackRock’s ETHA being the only fund to register net inflows.https://t.co/Hj2Gs49bWa pic.twitter.com/V3lk6iUqKB
— Wu Blockchain (@WuBlockchain) October 30, 2025
None of the 12 listed products recorded new inflows, marking one of the largest single-day withdrawals since these products went live earlier this year.
Outflows in ETFs were approximately $81.44M, whereas only the BlackRock ETF had minor inflows. The rotation indicates a less robust short-term institutional appetite in the wake of the market volatility.
Why Is Bitcoin’s Price Lagging Behind the 5- and 10-Year Bull-Cycle Models?
Market analyst Jason Pizzino warned that Bitcoin may be entering a turning point in its longer-term cycle.
He shared a comparative chart titled “Bitcoin Curves vs. Actual (2011–2025)” that shows a growing gap between current price performance and the historical 5- and 10-year composite bull-cycle curves.
Earlier this year, Bitcoin largely followed the projection. But since September, price action has flattened while the model continued to climb.
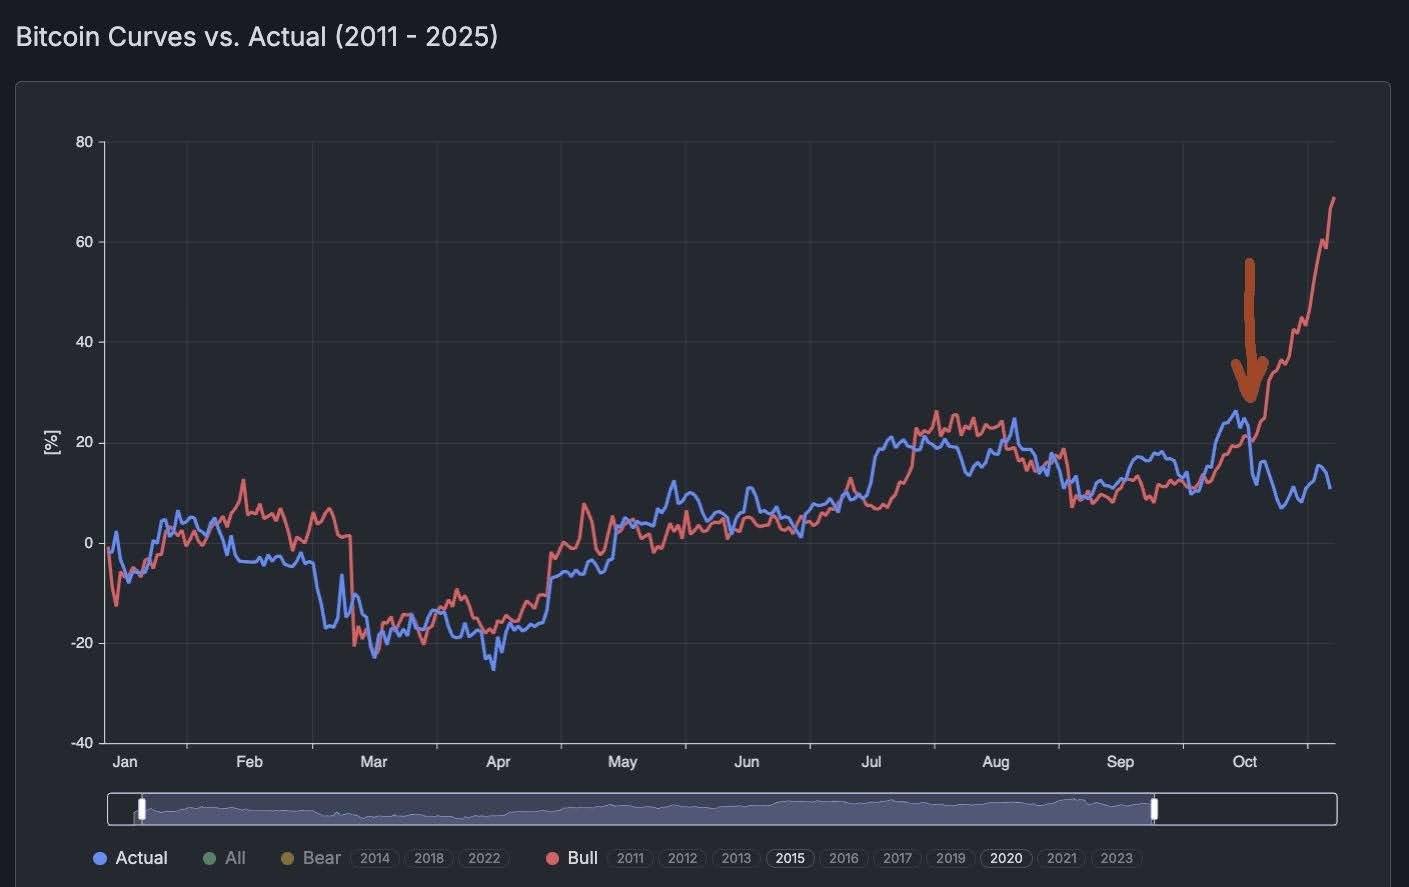
That slowdown is raising questions about whether BTC is falling behind its typical cycle rhythm.
As per CryptoQuant data, the Binance Exchange Whale Ratio has steadily crept its way upwards, indicating an increased percentage of large BTC transfers onto exchanges.
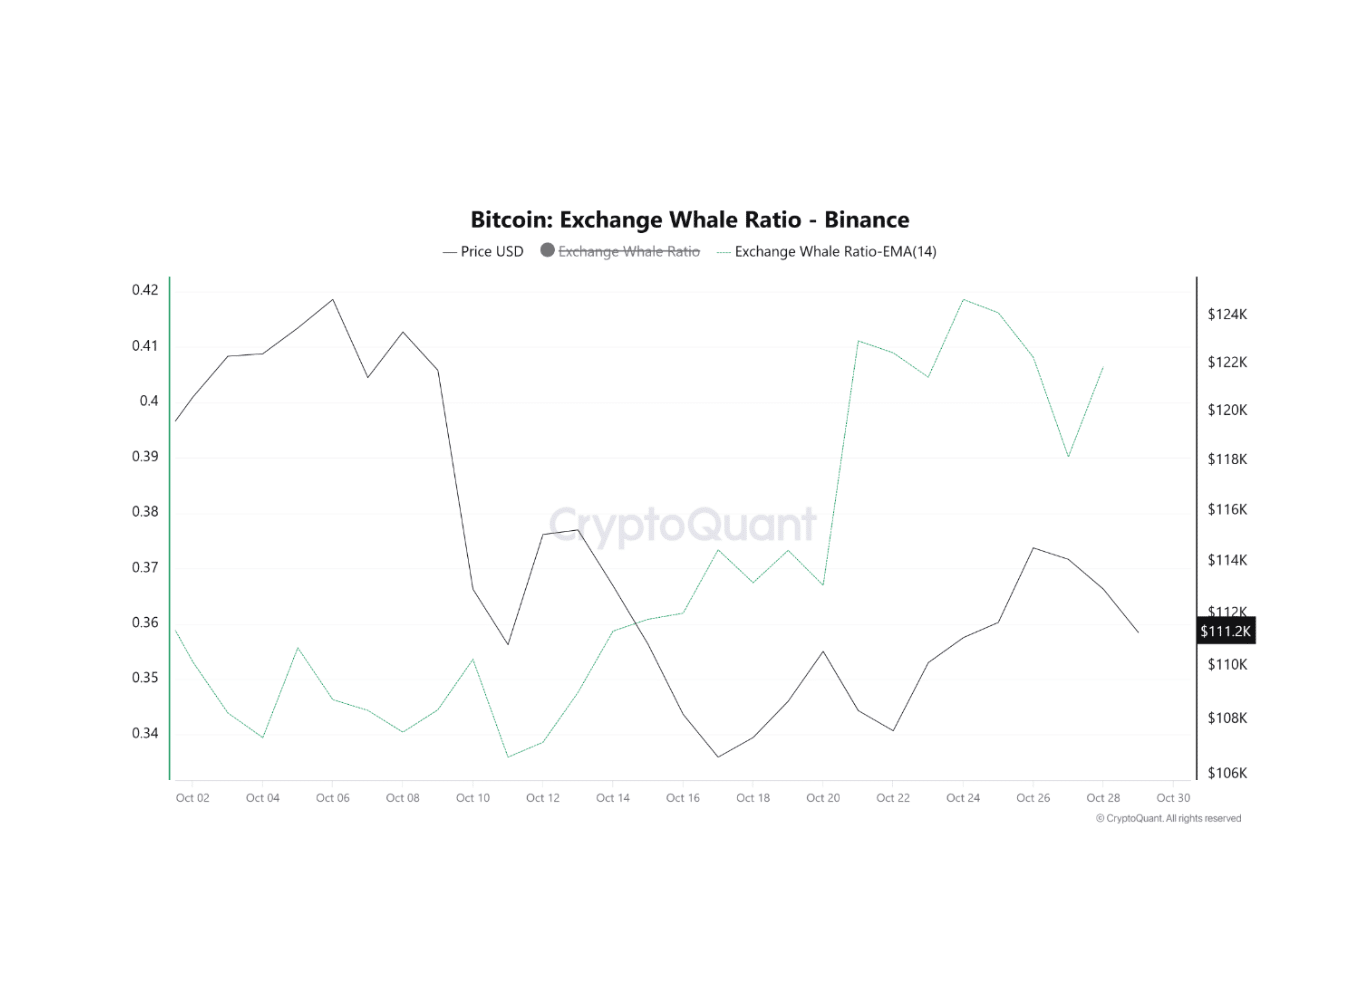
This is typically viewed by traders as an indicator that large holders may be about to sell.
DISCOVER: 9+ Best High-Risk, High-Reward Crypto to Buy in 2025
Ethereum Price Prediction: Does Weak Volume Signal Indecision Among ETH Traders?
Ethereum, meanwhile, continues to hold stronger ground.
According to Coingecko data, ETH is rising from approximately $3,900 to above $4,100. Over the past month, the token briefly reached $4,700 before easing back.
Analyst Daan Crypto noted that ETH is now moving inside a narrow mid-range after another failed attempt to break above its previous cycle high.
Ethereum is hovering below the $4,089–$4,100 band, a level where sellers have stepped in several times over the past few weeks. The setup hasn’t changed much.
Price keeps returning to this same patch, showing the market is stuck in a tight fight.
The chart marks the old cycle high near $4,089 as the main ceiling. ETH has attempted to break above it more than once, but each attempt has been repelled. Candles are moving to this level and wicking off, indicating a constant supply.
A clear conviction of price at the end of the day above this line will continue to position a long-term upward movement.
The most significant upward indication is the one that is close to the 2021 high, namely $4,864, but this can only be attained once the price first remains above the lower limit.
$ETH No changes here. Tried to get back above its previous cycle highs but got rejected again. Now back to this same area.
Levels are clear. No need to chop yourself up until then. https://t.co/xNJtY20B08 pic.twitter.com/i9snEib4HS
— Daan Crypto Trades (@DaanCrypto) October 30, 2025
The key floors on the other side, the Daily 200-EMA at $3,593. The recent price movement exhibits a steep drop into the 0.382 Fib zone, which has since been recovered, providing more weight to this zone.
If ETH fails to hold here, the next support sits near $3,319. The chart labels this as a “must-hold” level.
A clean break below it would likely weaken the broader structure and open the door to deeper downside toward earlier congestion areas.
Volume has tapered off compared with the strong buying seen earlier in the cycle. Such a contraction suggests that traders are uncertain about their next move.
There is no evident indication of intensive purchasing at these recent levels, suggesting a wait-and-see strategy.
The price action is caught in a price range, with ETH fluctuating between the support level of the 200-EMA and the resistance level, which is close to the last cycle high.
DISCOVER: 16+ New and Upcoming Binance Listings in 2025
The post Bitcoin ETF Outflows Signal Weak Sentiment While Ethereum Consolidates Near $4,100 appeared first on 99Bitcoins.
Bitcoin (BTC) News Today, Bitcoin News Today
99Bitcoins
[crypto-donation-box type=”tabular” show-coin=”all”]