
By Jonatan Randin, Market Analyst at PrimeXBT
The altcoin market is one of the most volatile areas in finance. While this volatility naturally adds risk, it also creates opportunity. With the right approach to risk management, traders can turn fast price movements into calculated setups rather than emotional decisions.
In this article, we’ll look at three common methods for managing risk on volatile assets, using TRB, PENDLE, and SEI as examples of how traders can adapt their approach to the market’s behaviour. These coins are available for trading on PrimeXBT, a global multi-asset broker that recently expanded its Crypto Futures lineup with over 100 new coins, providing traders with advanced risk management tools and the flexibility to navigate volatility with structure and control.
1. Price Action-Based Stop-Loss
One of the most straightforward ways to manage risk is by placing stop-loss levels based on market structure. For example, traders can position their stops below a recent swing low in an uptrend or above a recent swing high in a downtrend. This approach is widely used because volatility often plays out on an intraday basis, shaking out short-term positions before trend direction resumes. However, when volatility spills over into higher timeframes, a tighter stop can easily be triggered by normal price noise.
To manage this, traders can use higher-timeframe swing points as reference levels. Placing stops around these areas helps absorb smaller intraday fluctuations and filters out some of the short-term volatility that typically catches traders off guard. In assets like TRB, which often experience aggressive spikes and retracements, this approach helps maintain structure-based control without getting prematurely stopped out by random price movement.
Identifying Swing Points on TRB
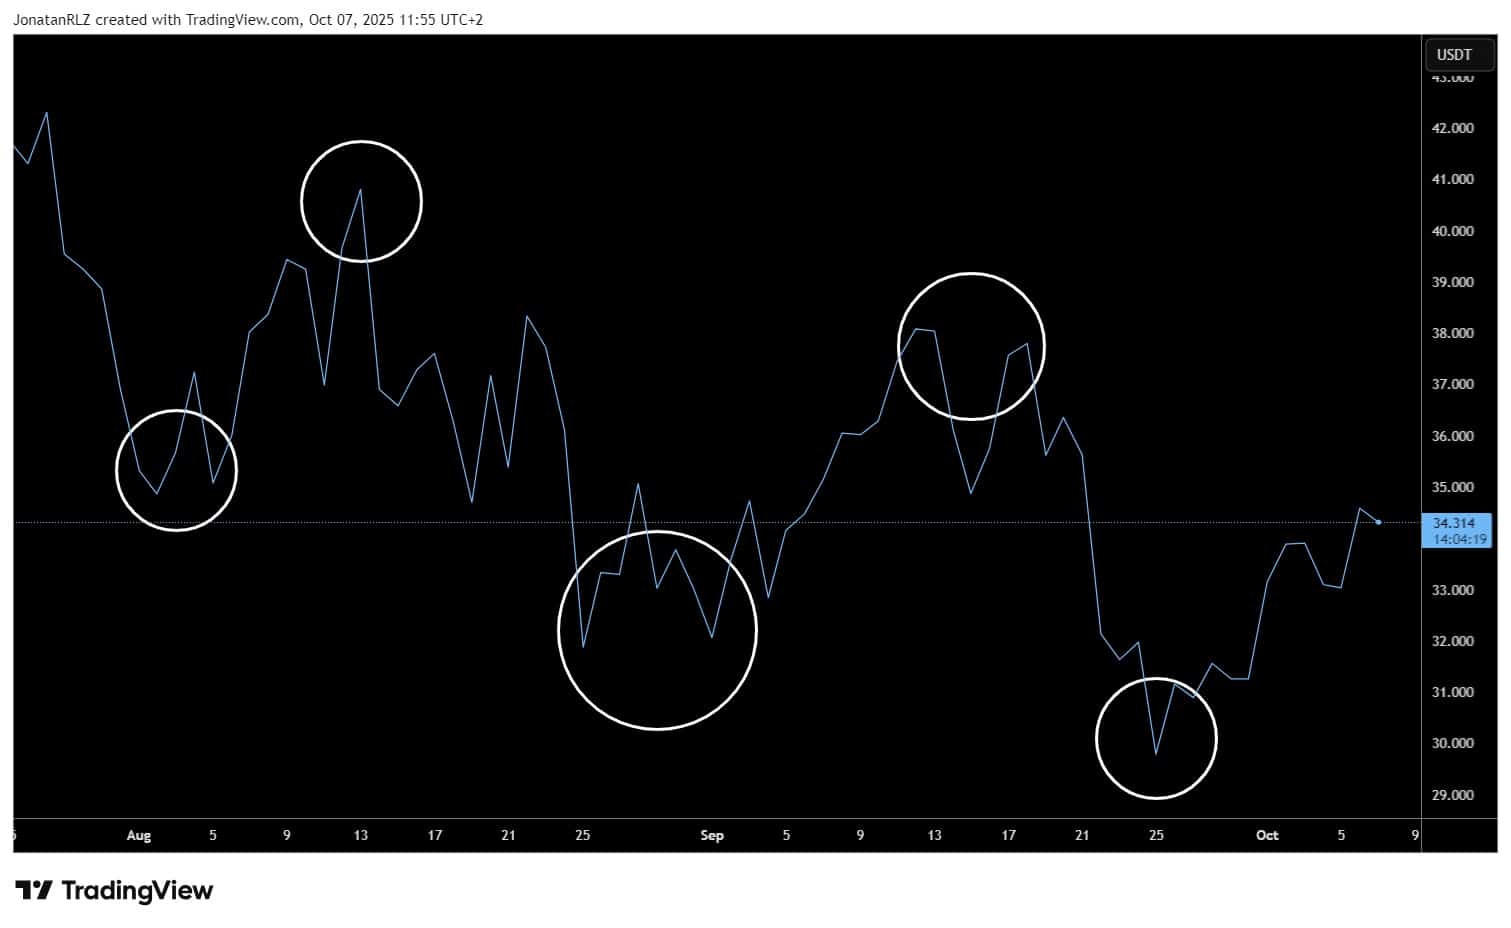
Another good way to identify major swing highs and lows is by switching from the candlestick chart to a line chart. The line chart smooths out intraday volatility and connects closing prices, making market structure easier to interpret.
In the example below, the TRB chart is displayed in line format, with white circles marking each swing point. These are the same structural pivots that form the foundation for placing stop-losses based on price action.
Identifying Swing Points With Advanced Tools
Now that we have looked at the basics of swing point identification, we can take it a step further and use a more structured method with multiple indicators. This approach helps visualise market structure clearly and define the levels that matter most for trend confirmation and invalidation.
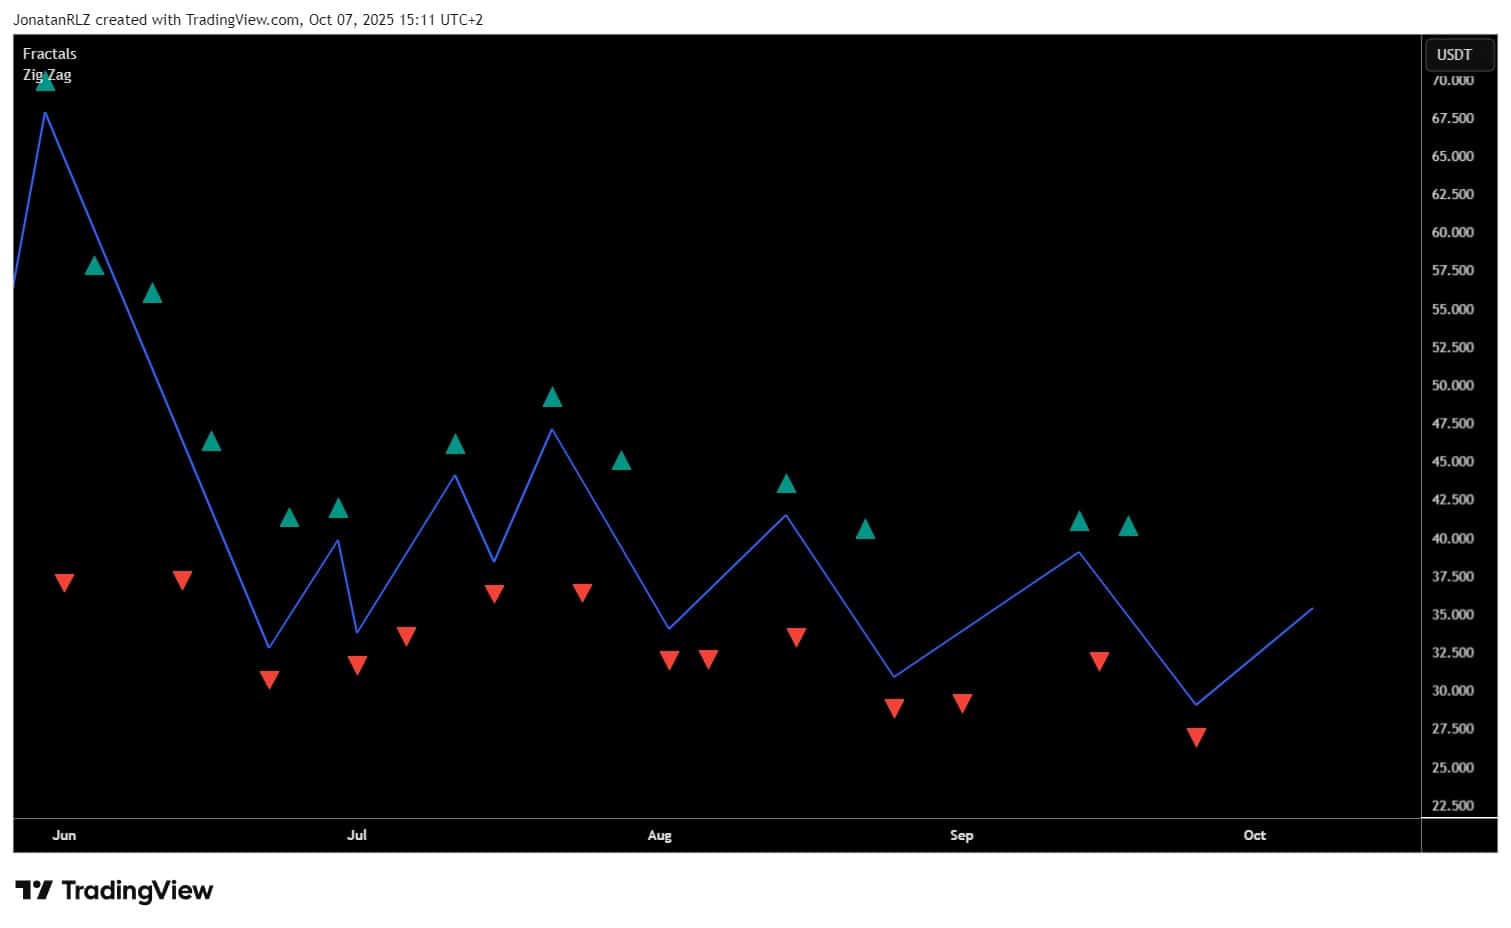
The process is as follows: start by adding the Fractals indicator, which is built into TradingView. It highlights local swing highs and lows using a three-bar pattern and marks them directly on the chart. Now, overlay TradingView’s built-in Zig Zag indicator and set the deviation threshold to 5 percent. This means that whenever the price moves more than five percent in the opposite direction, a new pivot is formed and the highs and lows are connected.
Next, open the Object Tree in TradingView and hide the actual price graph of TRB. The result is a clean chart showing only the structure indicators. In this setup, the blue line represents the Zig Zag, which can be viewed as the primary trend. Together, these indicators give a clear picture of how TRB is moving through its market cycles, helping identify valid swing points and levels of invalidation.
This layered technique is an effective way to find structure, confirm direction, and ensure that you are trading in alignment with the primary trend rather than against it.
2. Volatility-Based Stop-Loss Using ATR
The Average True Range (ATR) is a volatility indicator that measures how much an asset typically moves during a specific period. Instead of placing a stop-loss at a fixed price level, it can be set a certain multiple of the ATR away from your entry.
For example, if SEI has an ATR of 0.02, and the stop is placed at two ATRs below the entry, it adapts dynamically to the asset’s volatility. This method helps prevent getting stopped out by normal fluctuations while still maintaining clear invalidation. It’s particularly effective in fast-moving markets where static levels can be too easily swept.
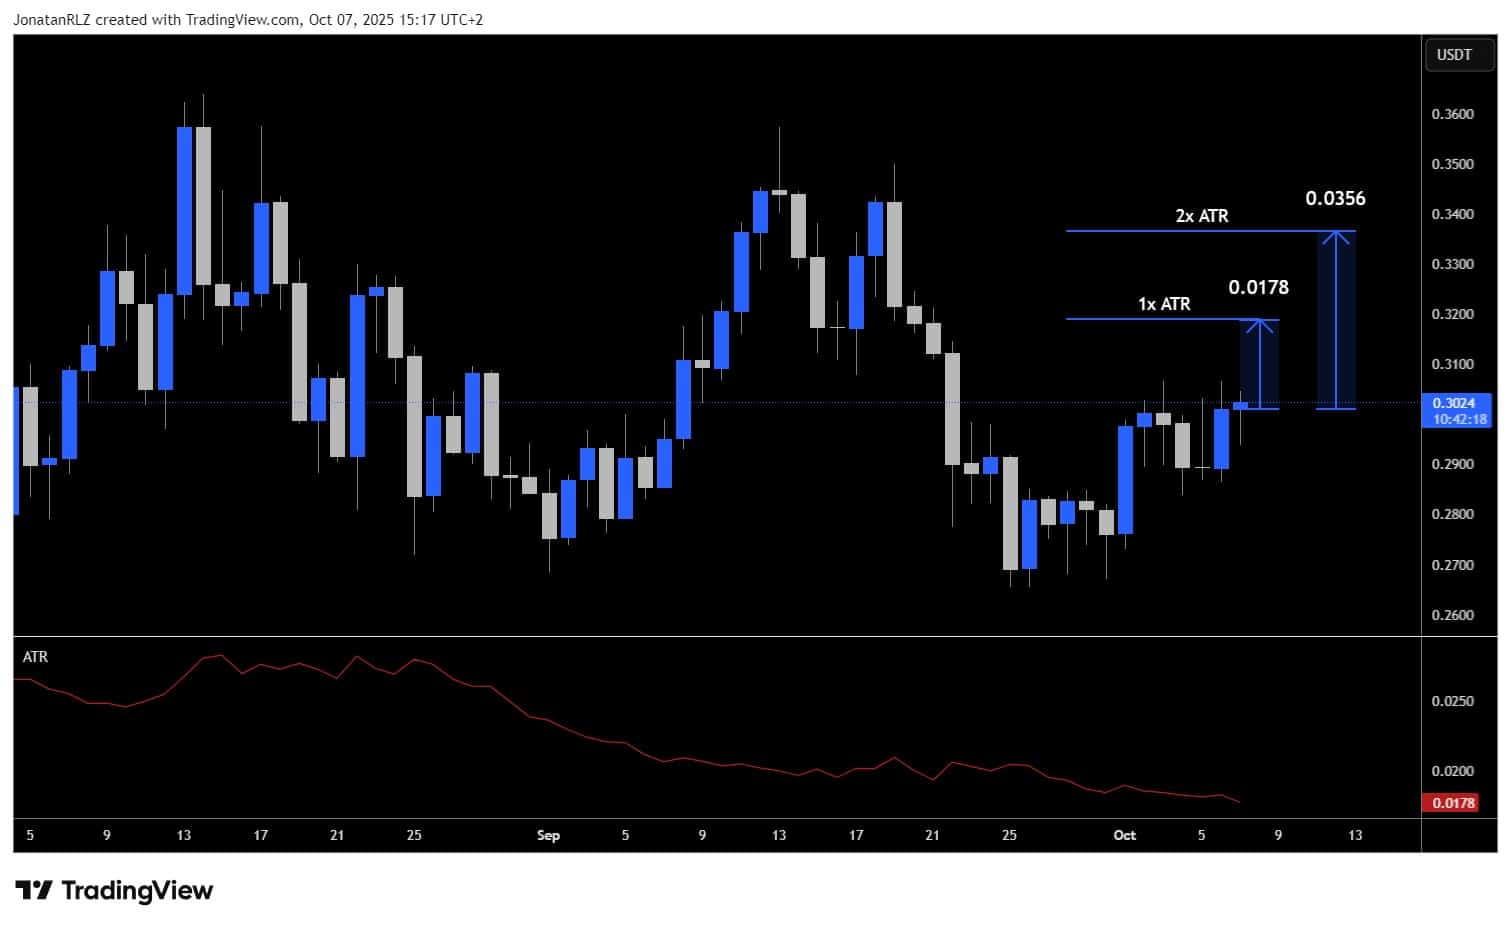
At the bottom of the chart, you can see the standard Average True Range (ATR) indicator. The value displayed by the ATR represents the average distance price has moved over a given period. This gives traders a clear idea of how volatile the asset has been recently.
To apply this information in risk management, the current ATR value can be taken and multiplied by two. If you then project that distance both above and below the opening price of the current candle, you create a zone that represents the typical range in which the price tends to move. When the price moves beyond this range, it indicates that volatility has exceeded its average level.
Using this concept, a stop-loss placed at two times the ATR provides a systematic way to account for volatility. It means that if the price moves roughly twice its average range against your position, the trade idea is likely invalid. This approach helps traders base their stop placement on measurable volatility rather than arbitrary distances, making risk management more consistent and data-driven.
3. Sell Half on a Double
For traders or investors who prefer longer-term exposure, another approach to risk management is to use position sizing instead of stop-losses. The idea is simple: only invest an amount you are fully comfortable losing, then let the trade play out over a longer time horizon.
Even though this example is based on PENDLE, this strategy can be applied to any low-cap altcoin with a promising long-term outlook. When the asset doubles in value, you sell half your position to recover your initial investment, leaving the rest as a “risk-free” hold. This technique, often referred to as sell half on a double, allows traders to stay exposed to potential upside while removing the emotional pressure that comes with short-term volatility.
Applying the “Sell Half on a Double” Strategy
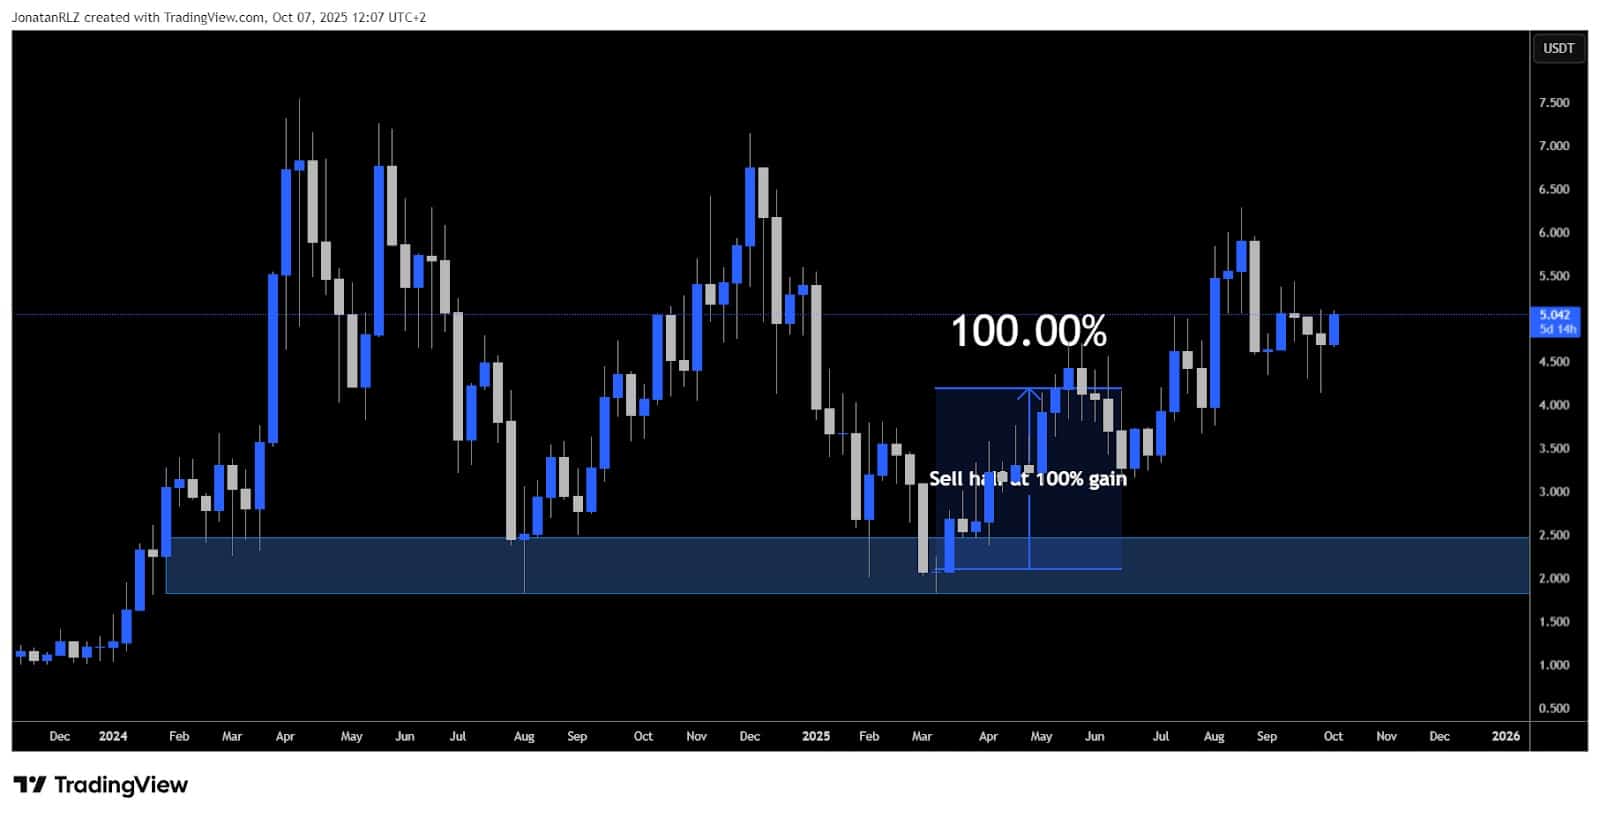
The chart above shows PENDLE on the weekly timeframe. If we assume a position was opened around March this year, the price would have doubled by May. According to this strategy, that is the point where half of the position would be sold, allowing the initial investment to be recovered while the remaining half is left to run for potential long-term gains.
This approach transforms a volatile altcoin trade into a risk-free position once the initial capital is secured. It removes emotional pressure from short-term fluctuations while keeping exposure to any continued upside, which is particularly valuable in trending markets.
Trading Crypto With PrimeXBT
Altcoin volatility is not something to fear, but something to understand. Each of these three methods provides a framework for working with, rather than against, market movement. Whether through structure-based stops, ATR-based volatility filters, or strategic long-term positioning, traders can approach volatility with more control, while remaining aware that risk is always present in trading.
PrimeXBT’s Crypto Futures platform is built around that same principle of balance — combining opportunity with control. The platform offers both isolated and cross-margin modes, adjustable leverage, transparent funding rates, and advanced order types to manage exposure efficiently. Traders also benefit from integrated analytics, customizable charting, and diversification options with unified access to not only Crypto Futures but also CFDs on Forex, commodities, indices, shares, and cryptocurrencies — all in one place.
Competitive trading terms and tiered benefits further enhance the experience. PrimeXBT’s fee structure is among the most cost-efficient in the market, featuring maker fees as low as 0.01% and taker fees starting from 0.15% for new users during their first 10 days as part of the VIP fees program.
By combining transparency, control, and flexibility, PrimeXBT enables traders to approach volatile markets with structure and confidence.
Disclaimer: The content provided here is for informational purposes only and is not intended as personal investment advice and does not constitute a solicitation or invitation to engage in any financial transactions, investments, or related activities. Past performance is not a reliable indicator of future results. The financial products offered by the Company are complex and come with a high risk of losing money rapidly due to leverage. These products may not be suitable for all investors. Before engaging, you should consider whether you understand how these leveraged products work and whether you can afford the high risk of losing your money. The Company does not accept clients from the Restricted Jurisdictions as indicated on its website / T&Cs. Some products and services, including MT5, may not be available in your jurisdiction. The applicable legal entity and its respective products and services depend on the client’s country of residence and the entity with which the client has established a contractual relationship during registration.
The post PrimeXBT: How to Turn Volatility Into Opportunity in the Altcoin Market appeared first on 99Bitcoins.
Sponsored
99Bitcoins
[crypto-donation-box type=”tabular” show-coin=”all”]