We ended the last article with a minimal x86-64 assembly program that assembled and ran, but then crashed with a segmentation fault. Before we move on to fix that properly, this is a good opportunity to step back and understand how to debug such issues.
In this part, we’ll use gdb to investigate what exactly went wrong. You’ll learn how to step through your program instruction by instruction, inspect memory and register values, and get a better sense of how the CPU executes your code. No new assembly instructions yet, just the tools to understand what you’re building.
If you haven’t seen the previous articles in the series, here’s what you have missed:
This article is part of a paid subscriber series.
If you’re enjoying the content, please consider upgrading to a paid plan to unlock the rest of this series. Paid subscribers also get access to recordings of past live sessions, early and discounted access to courses and books, and more.
Alternatively, you can purchase an ebook version of this series. (If you’re already a paid subscriber, email me for a discounted link.)
Quick Recap
Let’s start with a short recap of where we left things in the previous article.
We learned enough assembly to write the following program
# create the text section
.section .text

# mark the _start label as globally visible for linking
.globl _start

_start:
  movq $32, %rdi
  movq $10, %rsi
  addq %rsi, %rdi
Then we assembled and ran it as follows:
as -o false.o false.s
ld -o false false.o
./false
Segmentation fault (core dumped)
The program is mysteriously crashing, and our goal is to identify why. We will learn to use the debugger (gdb) to do this.
Assembling with Debug Symbols
To debug the program using gdb, the program binary needs to include the debug symbol table so that the debugger is able to show us the source code as we step through it. By default, the assembler and compiler don’t include the debug symbols in the binary because it increases the size of the program binary that can slow down the program startup time.
So first, we need to reassemble our program with debug symbols. To do that with the GNU assembler, we need to use the gstabs option, as shown below.
as -o false.o -gstabs false.sThe linking step remains the same. If the object file produced by the assembler contains the debug symbol tables, the linker will put them in the final executable without us asking it.
ld -o false false.oHere's the program we wrote earlier that was crashing:Debugging with GDB
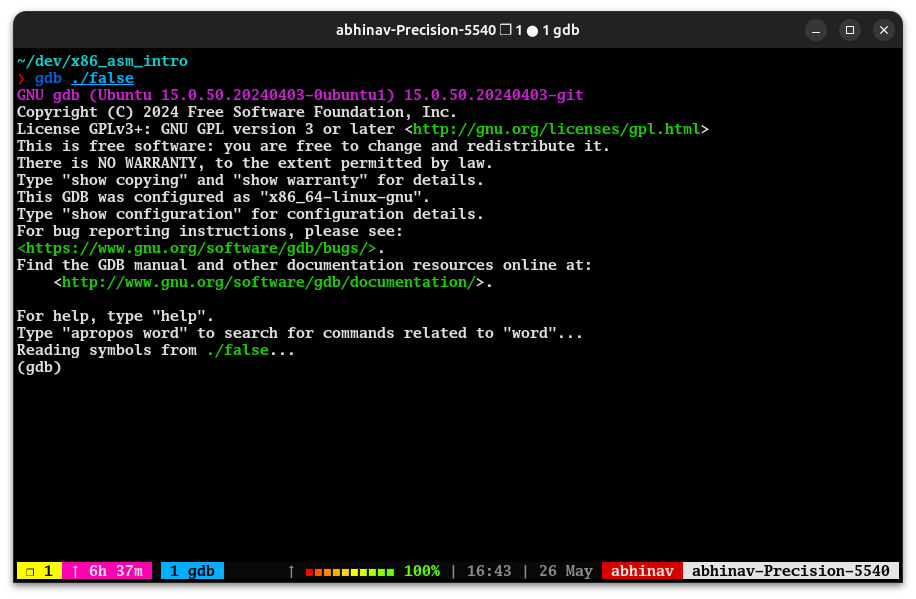
The simplest way to debug a program with gdb is to start the program with gdb as shown below.
gdb ./falseOnce you do that, you will see the gdb prompt, like the screenshot below.

The (gdb) thing is the GDB prompt, which is where we enter the debugging commands. The first command we will learn to use is to set up a breakpoint.
Setting and Hitting Breakpoints
Confessions of a Code Addict
[crypto-donation-box type=”tabular” show-coin=”all”]