This report is presented in partnership with Crypto.com, a regulated crypto platform focused on security, usability, and global access. Together, we work to make crypto easier to understand and access.
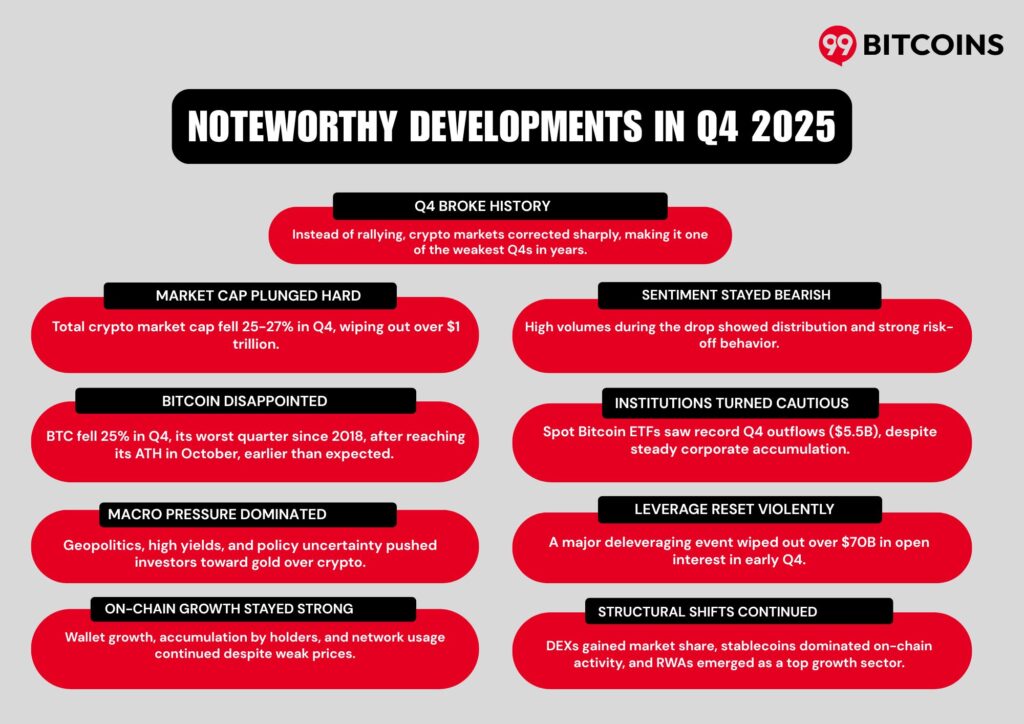
Q4 has historically been the strongest quarter for crypto, with Bitcoin delivering average returns of 79% since 2013. Q4 2025 broke that pattern; instead of rallying, the market corrected, falling short of expectations and leaving many investors disappointed heading into the new year.
Total crypto market cap rose 18-21% from $3.3T in Q2 to $4.0T in Q3 2025, before contracting 25-27% in Q4 to $2.9T, marking one of the sharpest quarter-over-quarter (QoQ) drawdowns of the year.
The market declined alongside elevated trading volumes. Thus, signaling distribution and heightened risk-off behavior from investors. Overall sentiment remained bearish, averaging in the fear zone, with confidence fading steadily as prices fell and volatility increased.
What Actually Happened in Q4 2025: Summary
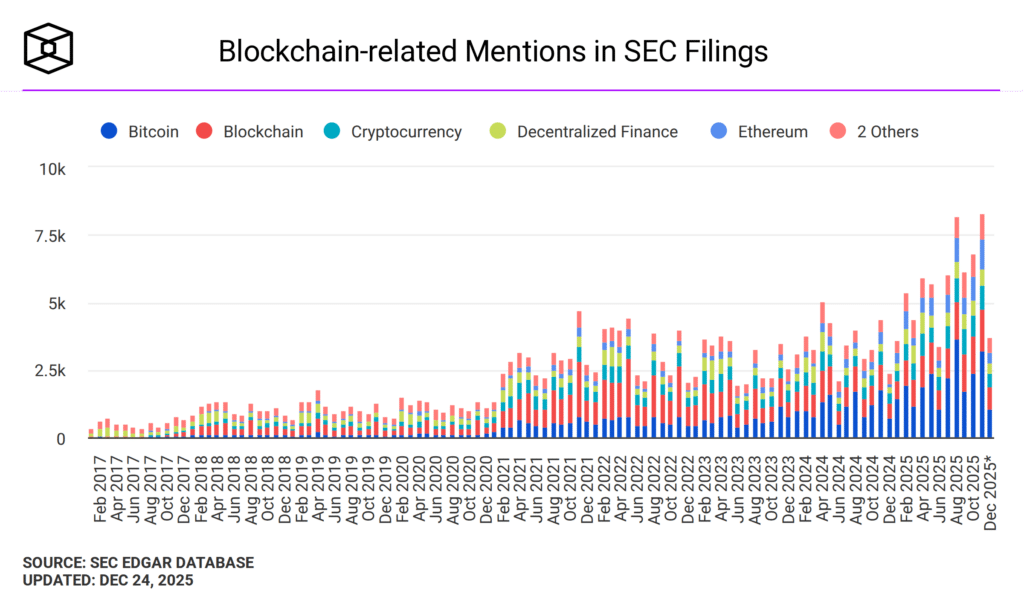
Retail search interest for Bitcoin remained almost flat through most of Q4, with only a brief spike in mid-November, and stayed well below the peaks seen in 2021. In contrast, blockchain-related mentions in SEC filings surged to a Q4 high of 8.26k in November, before dropping sharply in December.
Market Price Action & Sentiment
- Sharp Crypto Downturn: Bitcoin and the broader market corrected significantly in Q4 after reaching all-time highs in October, with BTC falling from approximately $126,000 to the mid-$80,000 range and the total market cap losing over $1 trillion in value within weeks.
- Cautious Trading Ahead of Macro Data: Late Q4 saw crypto prices remain volatile and reactive to U.S. inflation and macro signals, highlighting persistent risk-off sentiment.
Institutional & Regulatory Landscape
- Institutional Flows Mixed: Although BTC ETFs had previously attracted strong institutional flows earlier in the year, Q4 saw ETF outflows accelerate, and futures open interest remained high even as prices fell.
- Regulatory Developments Continue: The UK unveiled new crypto regulatory proposals to bring digital assets in line with traditional securities regulation.
- U.S. Legislative Delays: The Senate is putting key crypto bills on hold, continuing to pressure markets and pushing Bitcoin down.
Macro & Broader Financial Context
- Volatility Fueled by Macro: Market weakness in October-November was amplified by macroeconomic uncertainty, rising yields, and retreating risk appetite in traditional markets.
- Gold Outperformed BTC: Many investors rotated into traditional safe havens like gold as crypto losses deepened, reflecting a broader preference for less volatile assets.
Industry Structural Shifts
- Institutional Interest Remains Significant: Major financial firms like JPMorgan are exploring expanded crypto trading services for institutional clients, highlighting growing Wall Street involvement.
- Focus on Legal and Compliance: Private litigation and regulatory frameworks are emerging as key themes that may shape industry risk management in the future.
State of the Crypto Market in Q4 2025
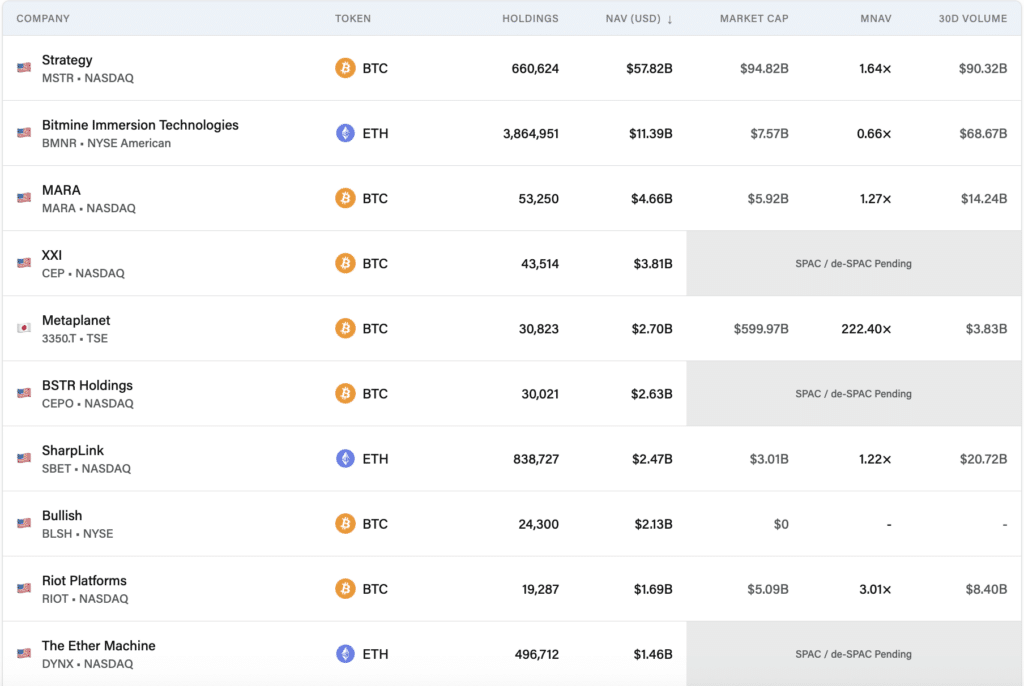
Investors this quarter were more focused on preserving their capital than trying to trade the market. Digital Asset Treasury (DAT) companies slightly increased their crypto holdings, with 118 firms now holding digital assets on their balance sheets. As of late December, the combined net asset value stood at $112.6 billion, with Bitcoin accounting for 83% of total holdings, or $93.4 billion.
Trading activity remained strong, with total volume reaching $887.3 billion over the past 30 days. Michael Saylor’s Strategy continued to dominate the landscape, holding an unmatched 660,624 BTC.
On the Ethereum side, 10 active companies collectively held 5,567,885 ETH, valued at approximately $16.4 billion. Among them, Bitmine Immersion Technologies emerged as the largest holder, with a substantial 3,864,951 ETH on its balance sheet.
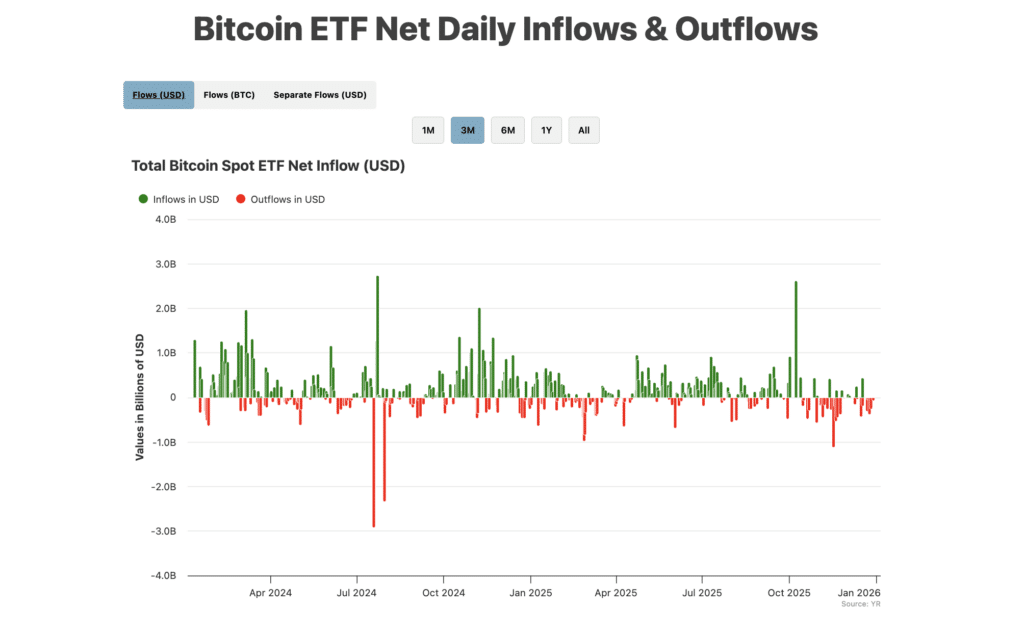
ETF flows were largely positive through mid-year, with several strong inflow spikes between July and September reflecting solid institutional demand. However, momentum shifted in Q4 as outflows became more frequent. While inflows still appeared intermittently, they were far less consistent, signaling growing caution among ETF investors.
Despite this pullback, corporate Bitcoin holdings continued to edge higher, highlighting a clear divergence in behavior. While ETF investors moved to lock in profits, corporate buyers quietly accumulated. In total, ETF outflows reached roughly $5.5 billion in Q4 2025, the highest level since spot Bitcoin ETFs launched.
BlackRock’s iShares Bitcoin Trust (IBIT) accounted for the largest share of these redemptions, including a single-week outflow of around $435 million.
After talking to various experts, 99Bitcoins learnt that, unlike Q3, crypto hiring picked up only in select, specialized areas. Companies showed a clear preference for experienced professionals, with demand shifting toward non-engineering roles such as compliance, operations, and risk management. Entry-level opportunities remained limited, as most employers focused on senior talent with cross-domain expertise.
Blockchain development continued to rank among the fastest-growing skills globally, while 99Bitcoins also observed rising demand for cybersecurity and blockchain security roles. According to RecruitBlock, the global crypto talent pool has grown by over 50% since 2020, with hiring expected to increase another 30% over the next two years. Remote work is set to remain dominant, as companies increasingly hire talent from across the world.
VC investment in crypto softened in Q4, pressured by a wider market pullback and reduced expectations for near-term upside in Bitcoin. This marked a clear contrast to VC funding trends in Q3. As per Galaxy Digital,
| Metric | Q3 2025 Data |
| Total VC investment in crypto startups | $4.59 billion |
| Quarter-on-quarter change (capital) | -59% QoQ |
| Number of deals | 414 deals |
| Quarter-on-quarter change (deals) | -15% QoQ |
| Capital share – Later-stage deals |
56% of total investment
|
| Capital share – Early-stage deals |
44% of total investment
|
| Top-funded category | Trading |
| Capital invested in trading category | $2.1 billion |
| Largest individual investments |
$1B in Revolut, $500M in Kraken
|
| Leading region by capital & deal count | United States |
| New crypto venture funds raised | 13 funds |
| Capital allocated to new funds | $3.16 billion |
A Look at Leverage Market & Stablecoin Adoption
Stablecoins now account for 30% of all on-chain crypto transaction volume, hitting a record $4 trillion+ in year-to-date volume by August 2025, up 83% from the same period in 2024. This surge in stablecoin usage has directly fueled growth in crypto-collateralized lending, which reached a new all-time high by the end of Q3 2025, overtaking the previous peak set in Q4 2021.
What’s changed is the market structure. On-chain lending dominated 66.9% of total crypto lending, up from 48.6% in Q4 2021, reflecting a clear shift toward decentralized borrowing. Within this segment, lending apps such as Aave now make up over 80% of on-chain borrowing, while CDP stablecoins like DAI have fallen to just 16%, down sharply from 53% in 2021.
Overall, the lending market has moved away from synthetic, crypto-backed stablecoins toward borrowing powered by centralized stablecoins like USDT and USDC. This shows a clear alignment with the broader rise in stablecoin adoption across on-chain activity.
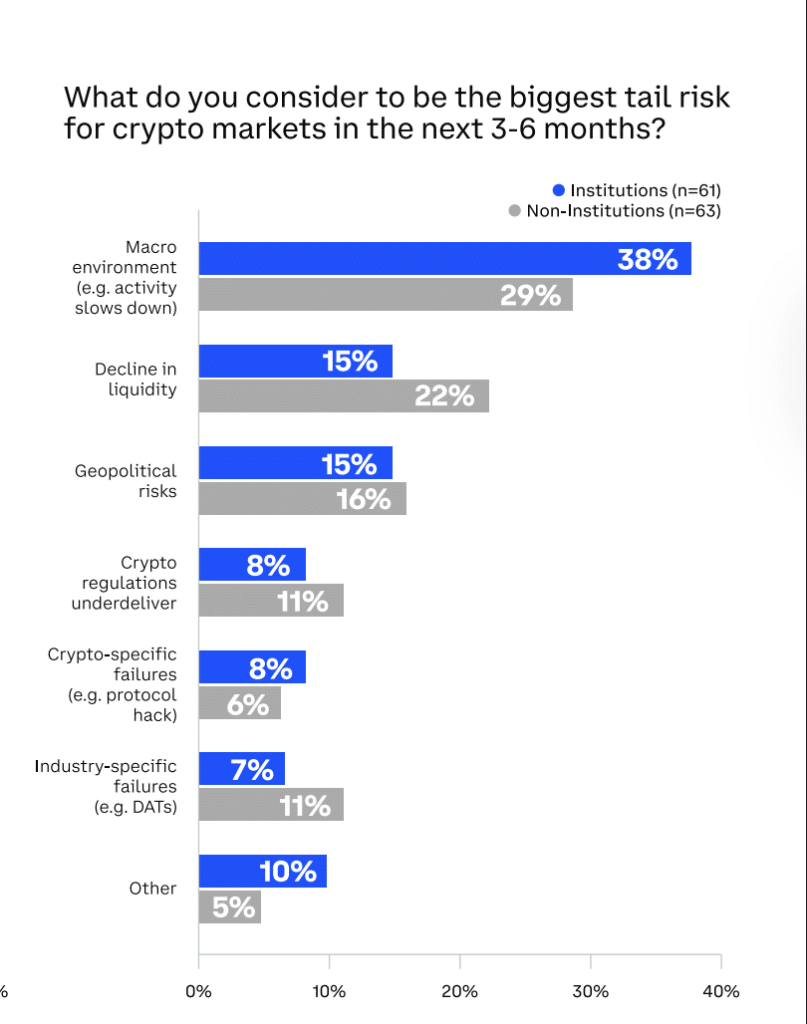
On the other hand, a Q4 survey of 120 global investors by Coinbase suggests a more cautious outlook. 45% of institutional investors and 27% of non-institutional investors believe the market is already in a late-stage bull cycle. If this view proves accurate, stablecoin adoption could begin to level off in 2026.
At the same time, 38% of institutional respondents believe that macroeconomic risks pose the biggest potential threat to the broader cryptocurrency market.
CEX vs. DEX Performance
The rising DEX-to-CEX spot trade ratio showed that DEXs are starting to capture an increasing share of spot trading volume from centralized exchanges. From virtually 0% in 2019 to 20–22% by 2025 end.
While CEXs still dominate spot trading, DEXs now hold on to a larger base level of activity in every cycle, even when overall crypto volumes fall, pointing to a long-term shift of trading activity away from centralized exchanges.
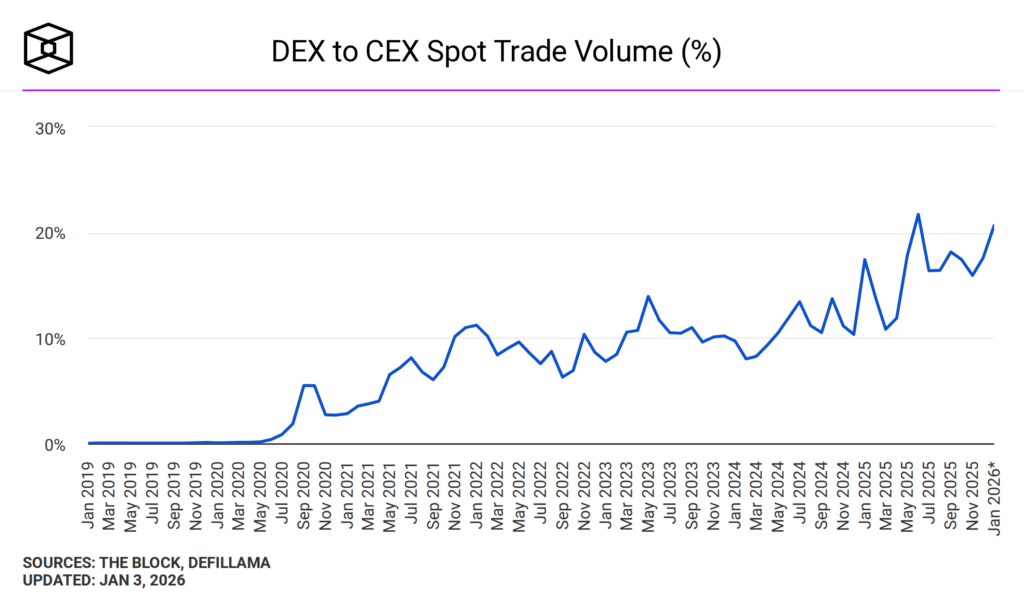
We noticed volatility favored DEXs during stress and momentum phases. The sharp spikes in 2024-2025 suggested that DEX usage increased during periods of heightened volatility, when traders prioritized: Self-custody, censorship resistance, permissionless access.
During these moments, CEXs faced withdrawals, downtime, or regulatory pressure, temporarily pushing volume on-chain. In summary, CEXs still process more total spot volume, but DEXs are outperforming on a growth-rate basis.
Crypto Derivatives Market
In 2025, cryptocurrency derivatives trading totaled about $85.7 trillion, with an average daily turnover of roughly $264.5 billion. Activity remained steady at around $200 billion per day in Q1, began climbing in Q2, and peaked above $300 billion during July-August and again in October.
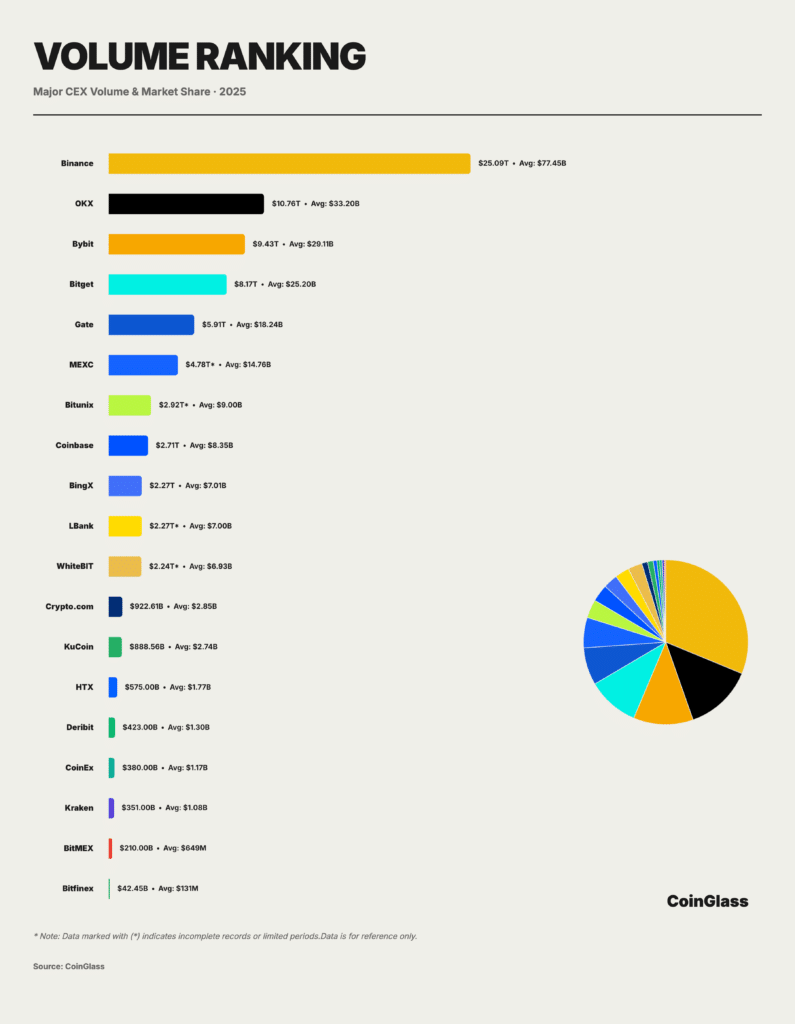
Despite the massive volumes, trading was highly concentrated among a few major exchanges. Binance dominated the market with $25.09 trillion in cumulative volume and an average $77.45 billion per day. Thus, giving it a 29.3% market share, nearly $30 of every $100 traded globally.
A clear second tier followed: OKX, Bybit, and Bitget each posted $8.2-$10.8 trillion in cumulative volume, with $25-$33 billion in daily averages. Combined with Binance, these four exchanges accounted for about 62.3% of total derivatives trading, underscoring the market’s strong concentration at the top.
In 2025, global crypto derivatives Open Interest (OI) told a story of panic, recovery, and overextension.
- Q1 (Jan-Mar): Sharp deleveraging phase, bottoming at $87B, reflecting panic-driven position unwinds.
- Q2 (Apr-Jun): Gradual confidence rebuild, with OI rising steadily as traders cautiously re-enter.
- Q3 (Jul-Sep): Aggressive leverage accumulation, pushing OI into a steep, one-way uptrend.
- Early Q4 (Oct 7): Peak leverage bubble at $235.9B, followed by a rapid crash.
- Late Q4 (Oct-Dec): Flash deleveraging wipes out over $70B in a single day, stabilizing near $145.1B by year-end.
Throughout 2025, forced liquidations across long and short positions totaled roughly $150 billion, averaging about $400-500 million per day.
A Quantitative Breakdown of Bitcoin
Bitcoin significantly outperformed altcoins over the year. In the first half, many investors expected an altcoin season, with capital rotating out of Bitcoin and into altcoins, but this shift never occurred. As a result, market sentiment turned increasingly bearish. This was reflected on Polymarket, where 77% of participants predicted that Bitcoin would reach $80,000 before $150,000, while only 23% expected the higher target to be reached first.
Q4 is usually Bitcoin’s strongest quarter, but this time it was a shock. Bitcoin fell nearly 25% during the quarter, making it the worst Q4 since 2018, when the market was deep in a bear phase.
For more than a decade, the four-year cycle model had worked well and pointed to a peak in late 2025. Bitcoin topped in November 2013, December 2017, and November 2021, so most investors expected another November or December high in 2025. Instead, the market surprised everyone. Bitcoin peaked in October, much earlier than market expected, breaking the long-held pattern. Interestingly, many analysts think that the 4-year cycle is still intact. As per the founder of Into the Cryptoverse, Benjamin Cowen:
We had a top in the fourth quarter of the post-halving year. But the nature of the current bear market is tracking the 2019 bear market, more than the 2014, 2018, and 2022, where it was just a slow bleed off the top. And what’s interesting is the top also occurred just before quantitative tightening (QT) ended. So the June 2024 top was 2 months before the QT ended in August and October 2025 top was 2 months before QT ended in December.
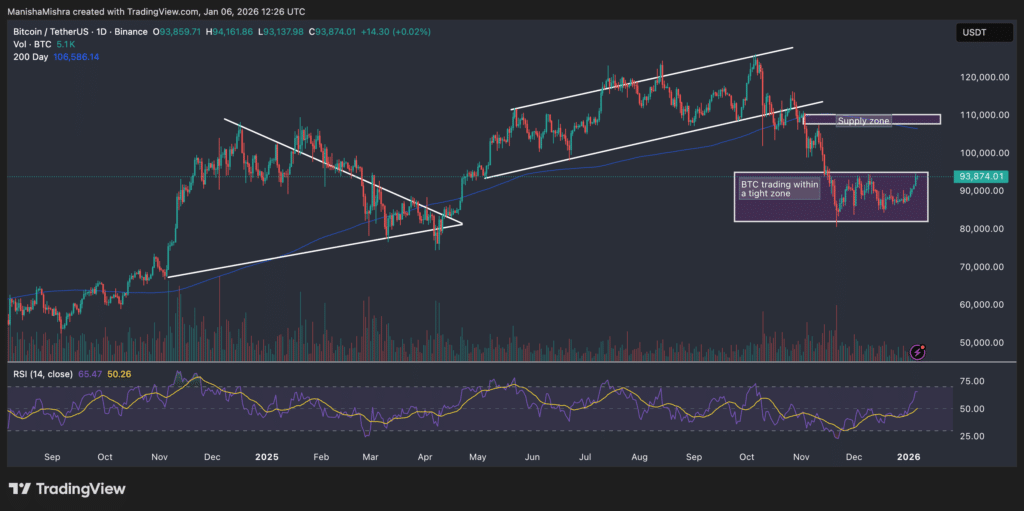
Bitcoin entered Q4 already extended after a strong H1. Price had been trending inside a rising parallel channel since roughly May-June 2025. This channel represented controlled bullish expansion, not parabolic excess, until late Q3. In early October, BTC rejected the upper boundary of the rising channel.
That rejection marked the cycle high and preceded a shift from trend-following to distribution. The market peaked earlier than historical Q4 seasonality suggested. Thus, setting the stage for a failed bullish continuation.
Analysis of Technical Indicators
- The first major pullback occurred when BTC lost the midline of the rising channel, then broke the lower channel support decisively.
- This was not a wick-based failure; it was multiple daily closes below trend support, confirming a structural breakdown.
The $108k-$112k Supply Zone
The highlighted supply zone aligns with:
- Prior consolidation support
- The underside of the broken channel
- A descending trendline retest
Bitcoin attempted multiple relief rallies into this zone during Q4 and failed each time. This zone acted as a distribution ceiling, preventing any sustained bullish recovery.
Tight Trading Zone: $81k-$95k
After the aggressive sell-off in November:
- BTC entered a tight horizontal range
- Volatility compressed sharply
- Directional conviction vanished
- Market saw failed breakdowns below $85k
- This was a post-distribution equilibrium
- Weak hands exited, strong hands absorbed supply
Moving Average (200-Day MA) & RSI Behaviour
Q4 mostly saw buyers’ exhaustion as sellers gained strength and supply increased.
- The 200-day moving average acted as long-term resistance; every rally stalled below this MA.
- Long-term trend bias flipped from bullish to neutral-to-bearish
- RSI stayed mostly between 35-55
- No sustained oversold (<30) conditions
- Each RSI bounce failed near the midline (50)
Meanwhile, Bitcoin’s dominance remained high throughout Q4 as investors placed most trust in the king coin.
What Shaped Bitcoin’s Price Trajectory?
Bitcoin’s Q4 price action was driven by a mix of forces, including shifting macroeconomic conditions, on-chain dynamics, and the ongoing tug-of-war between demand and supply.
Macroeconomic Factors
99Bitcoins’ research shows that geopolitical factors came out as a major macro driver in Q4, shaping overall market risk sentiment. Rising conflicts, trade tensions, and energy-market disruptions redirected capital toward traditional safe havens like, while higher-beta assets such as Bitcoin faced increased pressure.
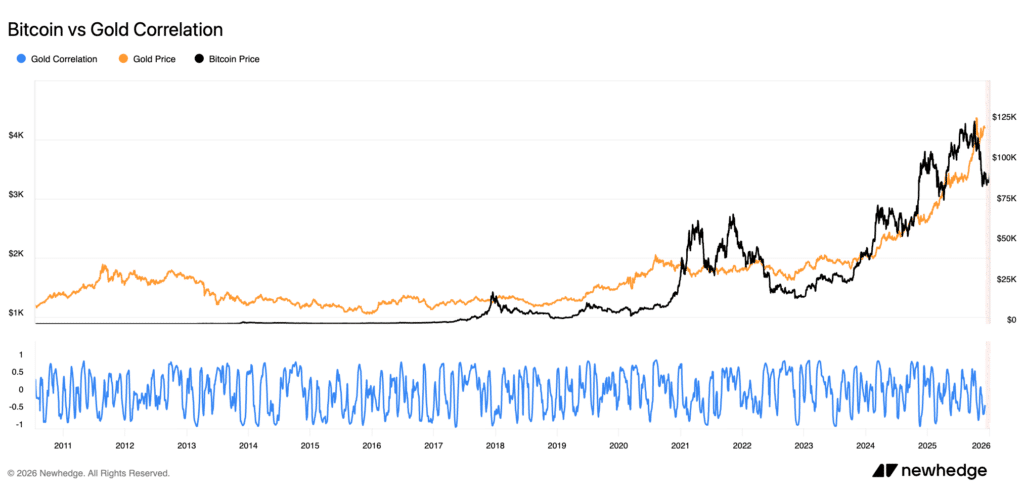
Geopolitical Tension & BTC-Gold Correlation
Recent U.S. actions related to Venezuela raised geopolitical tensions, increasing safe-haven demand. Meanwhile, Russia continued military actions targeting Ukraine’s Black Sea ports and energy infrastructure, threatening global trade and commodity supplies. These factors supported gains in gold and silver, while oil prices stayed relatively stable due to an abundant global supply. The rise in geopolitical risk also briefly influenced Bitcoin’s price, as investors reacted to the uncertainty.
Owing to investors’ declining confidence in the crypto market, we saw the Bitcoin-Gold ratio drop to its lowest level in nearly two years. Gold continued to attract safe-haven flows, while Bitcoin peaked earlier and underperformed through consolidation and pullbacks.
Bitcoin’s relationship with U.S. equities strengthened during periods of stress in Q4. As equity markets became more volatile toward the end of the year, Bitcoin showed a higher positive correlation with the S&P 500, moving largely in the same direction rather than decoupling.
U.S. & Global M2 Money Supply
During this period, the U.S. M2 money supply continued to expand, reaching a fresh record of roughly $22.3–$22.4 trillion by November 2025. At the same time, global M2 also increased, standing at approximately $97.47 trillion as of January 6, 2026.
However, despite these new highs in U.S. and global liquidity, fresh money did not meaningfully flow into risk assets during Q4. A large portion of the liquidity expansion was absorbed by government debt issuance, money-market funds, and bank reserves. As a result, Bitcoin failed to benefit from the traditional “excess liquidity” effect that powered previous bull markets.
Fed Rate Cut, High Tariffs & De-Dollarization Narrative
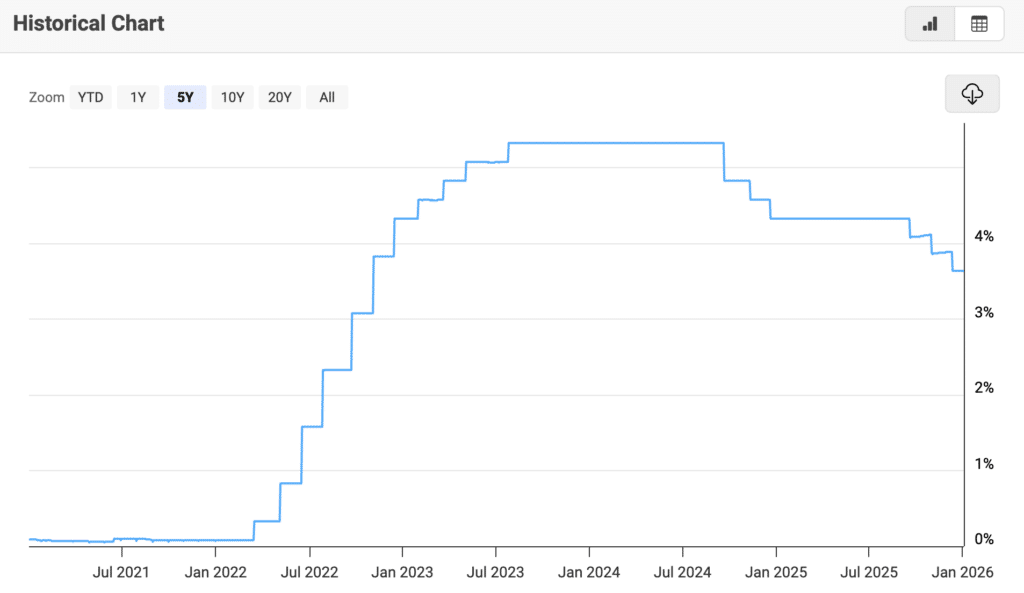
In December, the Fed delivered a widely expected 25-bps rate cut, lowering the federal funds rate to a range of 3.5%-3.75%, marking the third cut of the year. Meeting minutes showed that most FOMC members believe further cuts may be appropriate next year if inflation continues to ease, though policymakers remain divided on risks.
Some warned that sticky inflation could require higher rates for longer, while others favored deeper cuts to address early signs of labor market softening. The SEP also pointed to a more optimistic growth outlook for next year, reflecting a smaller-than-expected impact from tariffs. However, we must also highlight that investors’ confidence in the Fed’s data was at its lowest point in the last quarter.
One of the biggest shocks to the crypto market came in early April, when President Trump announced sweeping new tariffs, triggering a sharp risk-off move across stocks, crypto, and commodities. The impact was especially severe for import-dependent areas like blockchain development and crypto mining.
Higher tariffs pushed up the cost of mining hardware, components, and energy, adding pressure on miners worldwide. As trade tensions rose, market volatility jumped, with Bitcoin’s 30-day realized volatility climbing from 45% to 68% in April.
A 25% tariff on machines like the Antminer S19 added around $1,250 per unit, forcing miners to optimize or relocate operations. Even so, Bitcoin network hashrate growth has slowed by about 12% since March, reflecting growing disruption in global mining supply chains. Basically, tariff announcements earlier in the year increased global trade uncertainty, and their effects carried into Q4. Investors became more cautious, reducing exposure to Bitcoin.
99Bitcoins also found that De-dollarization, led by BRICS trade discussions, local-currency settlements, and reduced reliance on the U.S. dollar, remained a powerful macro theme in Q4. In theory, this should favor crypto, especially Bitcoin. However, in relaity, the narrative did not translate into immediate capital inflows.
U.S. Policy Support, Rising Debt & Bond Market Pressure
Investors got more clarity about the crypto market structure legislation, widely viewed as the next major regulatory milestone after the passage of the GENIUS Act on stablecoins. Several U.S. crypto bills expected to progress in 2026 could significantly improve market confidence.
|
Bill
|
What It Does |
Why It Matters in 2026
|
| CLARITY Act (Digital Asset Market Structure) | Defines crypto asset classification and SEC-CFTC oversight |
Could unlock institutional participation by removing regulatory uncertainty
|
| GENIUS Act (Stablecoins) | Creates federal framework for payment stablecoins |
2026 rollout accelerates bank, fintech, and enterprise adoption
|
| Stablecoin Issuer Framework (House bills) | Regulates state & federally approved stablecoin issuers |
Complements GENIUS Act execution in 2026
|
| Crypto Tax Reform Proposals (Expected) | Simplifies crypto taxation (staking, payments, reporting) |
Could lower friction for users and investors
|
U.S. federal debt climbed to $38.5 trillion in 2025, rising by $2.3 trillion over the year, or roughly $6.3 billion per day. Meanwhile, long-term Treasury yields remained range-bound in the low-to-mid 4% range, with the 10-year yield hovering around 4.15-4.19% by late December, near multi-month highs but below earlier peaks. These elevated yields made bonds more attractive than risk assets like crypto, weakening speculative demand.
That said, several analysts 99Bitcoins spoke to expect Bitcoin to eventually catch up to gold, as markets increasingly price in long-term currency debasement risks.
On-Chain Factors
On-chain data painted a far more constructive picture beneath the surface. Bitcoin added roughly 3.42 million net new non-empty wallets over the year, while Ethereum added about 34.85 million, nearly ten times more than Bitcoin. This growth pointed to steady accumulation and user onboarding, particularly among smaller holders, even as prices struggled to sustain rallies.
Whale activity remained largely patient rather than aggressive, while retail participation continued to build during consolidation phases. The widening gap between muted price performance and expanding network usage emerged as one of the year’s defining themes.

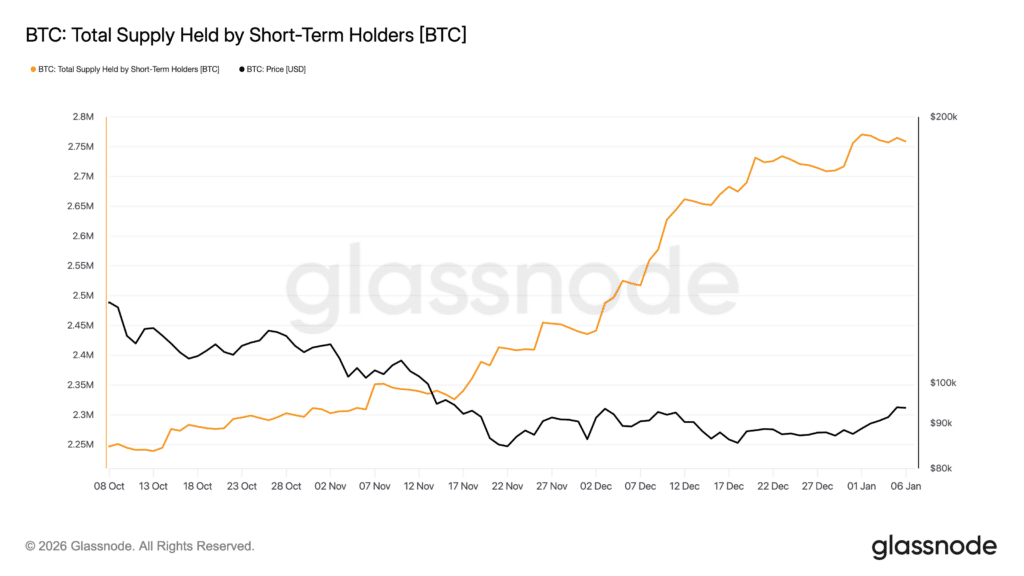
Key stakeholders holding between 10 and 10,000 BTC ramped up accumulation sharply throughout Q2, with no clear signs of slowing. At the same time, retail investors grew more cautious about how shifting monetary policy might affect their portfolios.
In fact, short-term holders steadily accumulated Bitcoin while price struggled to move higher. From October to early January 2026, the supply held by short-term holders rose sharply, even as BTC prices fell and then moved sideways. This suggests new or speculative buyers were entering the market, absorbing coins during dips and consolidation.
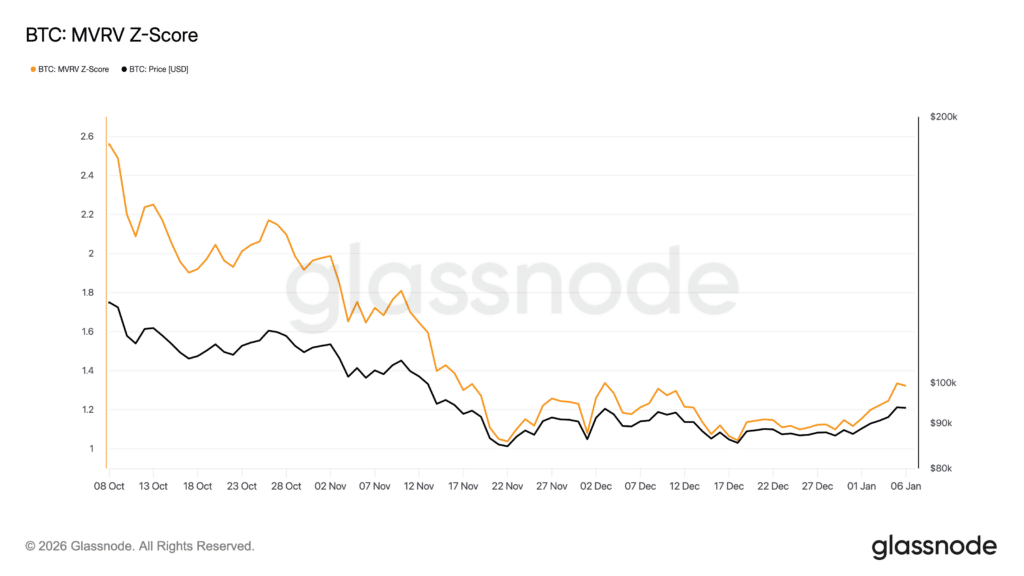
On the other hand, Bitcoin’s MVRV Z-Score steadily cooled throughout Q4, falling from elevated levels into a more neutral zone as prices declined and consolidated. This indicated that overvaluation pressures eased, with unrealized profits shrinking and speculative excess being worked off.
By late Q4 and early January, the Z-Score stabilized and began to tick higher alongside price, suggesting the market had reset from overheated conditions and was moving toward a healthier, more sustainable setup rather than a cycle peak.
After the October crash, markets moved into November with more caution. Traders cut position sizes and adjusted their risk, knowing policy news could still cause sudden price moves. Volatility stayed high, but leverage fell as traders became more defensive. To better understand market sentiment, we spoke with Ben Schiller, Head of Communications at Miden, a pioneering blockchain protocol. He noted,
There’s a lot of fatigue in the market right now, along with a wave of optimism around the Trump administration. The retail-driven phase of this cycle is still missing, we haven’t seen the level of retail participation that existed before the pandemic. Looking ahead to 2026, we expect Bitcoin to move higher, but the privacy coin sector is also one to watch, as it’s starting to gain momentum this year.
An Overview of Ethereum
Ethereum ended Q4 2025 down 28.28%, making it the fourth-worst fourth quarter in its history. Despite the price decline, network activity hit record levels.
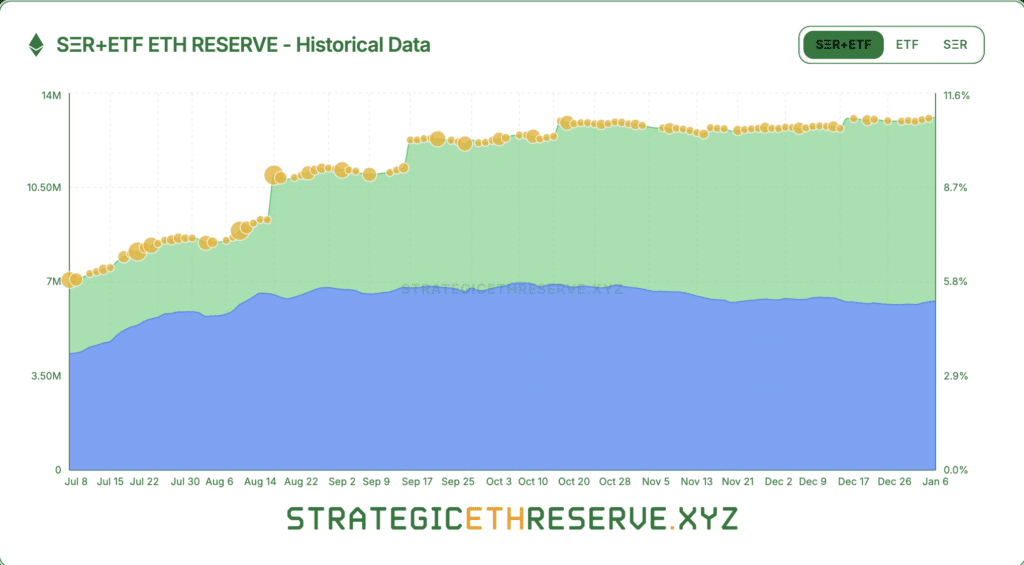
SER entities (large holders like institutions or custodians) held 6.81 million ETH, worth about $21.94 billion. This represented 5.63% of Ethereum’s total supply, spread across 67 major participants. Ethereum ETFs, on the other hand, held 6.27 million ETH, valued at roughly $20.2 billion, which equalled 5.18% of the total ETH supply.
Ethereum spot ETFs shifted from strong inflows earlier in the year to net outflows, as ETH prices corrected sharply. October still saw mixed but relatively stable flows, while November and December were dominated by persistent red bars, showing sustained ETF selling.
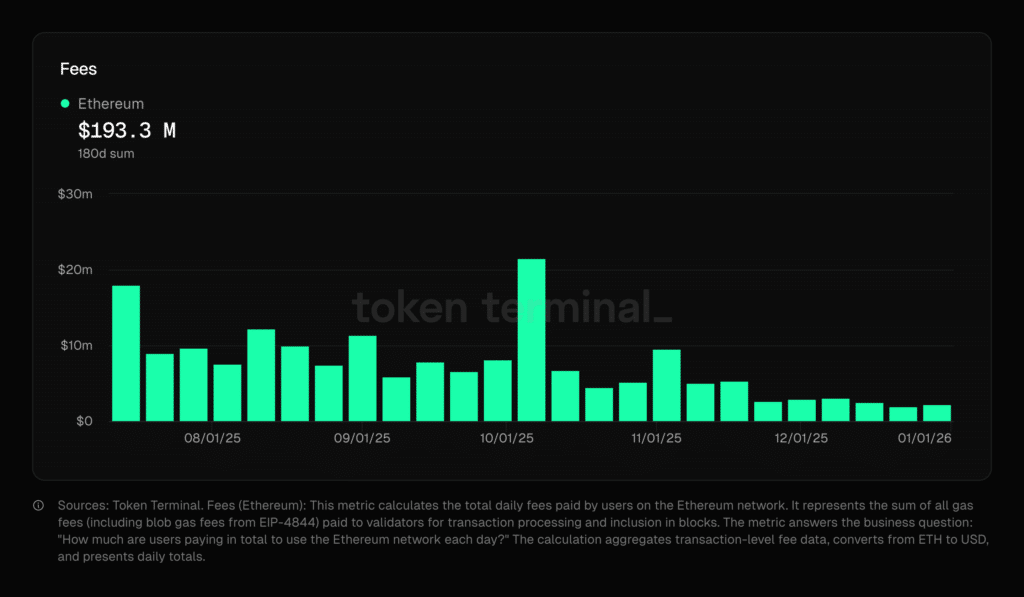
According to Token Terminal, developers deployed 8.7 million smart contracts during Q4, the highest quarterly total ever. Stablecoin transfer volume on Ethereum also reached a new all-time high, surpassing $8 trillion in the quarter. This surge in activity pushed daily transactions to a record 2.23 million in late December, with transaction counts now up 48% year over year. Active monthly addresses also climbed to a new high, reaching 10.4 million in December.
Ethereum had two major upgrades in 2025, Pectra in May, focusing on staking and wallet functionality, and the significant Fusaka upgrade in December, which dramatically boosted Layer 2 scalability. The market, therefore, saw a great reduction in gas fees, which was in sharp contrast to earlier bull markets.
Through the technical analysis we found, Ethereum entered Q4 after peaking near the $4,800-$5,000 zone in late Q3. In October, the price broke down from its prior uptrend, forming a series of lower highs and lower lows, confirming a short-term bearish structure.
Looking at ETH Through a Technical Chart
The sharp sell-off from October into November marked a trend reversal, not just a shallow pullback. Momentum clearly weakened as buyers failed to defend previous support levels.
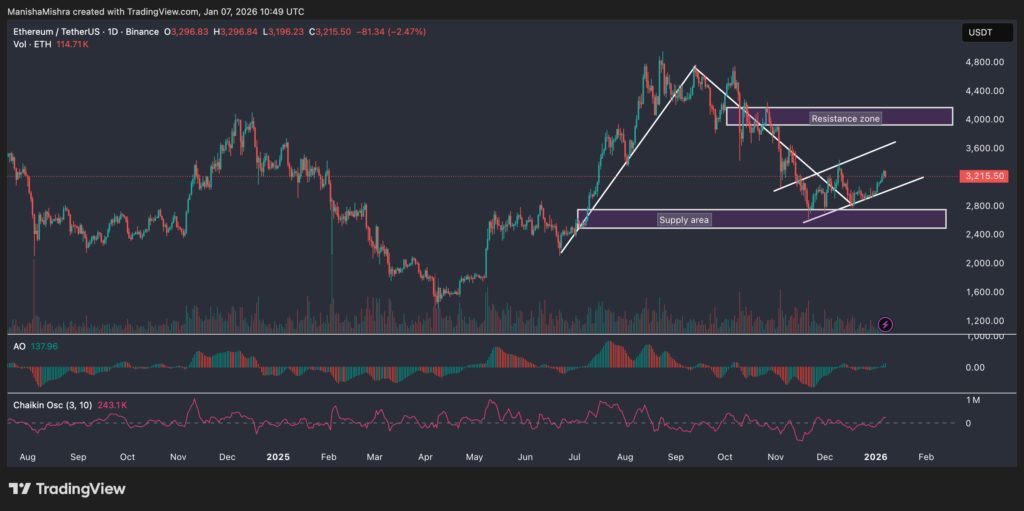
During November, ETH traded inside a descending channel, reflecting controlled but persistent selling pressure. Into December, price began to compress and stabilize, forming a modest ascending structure from the lows. Thus, suggesting selling pressure was fading. This price behavior points to distribution earlier in Q4, followed by base-building toward year-end.
Key Levels: Resistance and Support
- Resistance zone ($3,900-$4,189): ETH repeatedly failed to reclaim this area in Q4, turning former support into strong resistance. Every rally into this zone was sold into aggressively.
- Demand zone ($2,419-$2,769): Price found a base here in November and December. This zone acted as a structural floor, preventing deeper correction.
By late Q4, Ethereum was trapped between strong resistance above and solid demand below, noting sideways price action for a brief period.
Momentum Indicators
- Awesome Oscillator (AO): AO remained mostly below zero through Q4, confirming bearish momentum. However, by late December, momentum began to flatten and slightly improve, signaling downside exhaustion rather than renewed strength.
- Chaikin Oscillator: Capital flows were weak for most of the quarter, but stabilization toward the end suggests selling pressure eased, even though strong accumulation had not yet resumed.
Ethereum ended Q4 well below its Q3 highs, confirming the quarter as a distribution and correction phase.
Ethereum Staking Health Overview
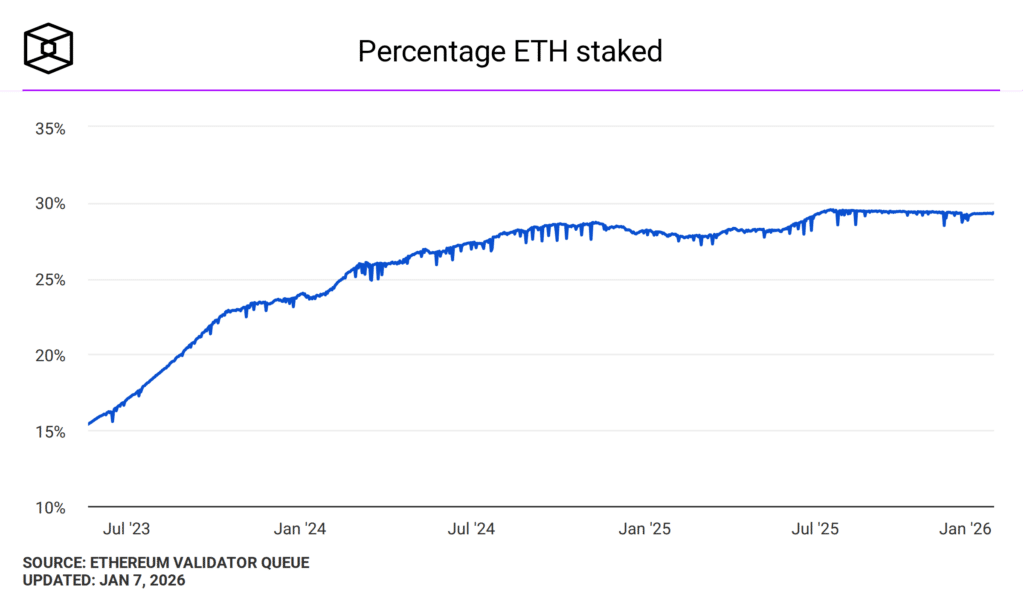
We found a structural uptrend in Ethereum staking, even through periods of price weakness. In Q4, the percentage of ETH staked held near the upper end of its historical range, around 28-29%, with only minor and short-lived dips.
This showed validator exits were limited and long-term stakers largely chose to stay invested despite market volatility. Investors had strong conviction and confidence in Ethereum’s long-term outlook. Basically, Q4 price drawdown did not translate into a loss of trust in Ethereum’s network security or yield dynamics.
While total ETH staking rewards continued to grow over time, the staking yield steadily declined as more validators joined the network. Early on, rewards were high due to low participation, but as staking became more popular, yields compressed into the low single-digit range. By Q4 2025, staking rewards largely stabilized around 3-4%, reflecting a more mature and competitive staking environment.
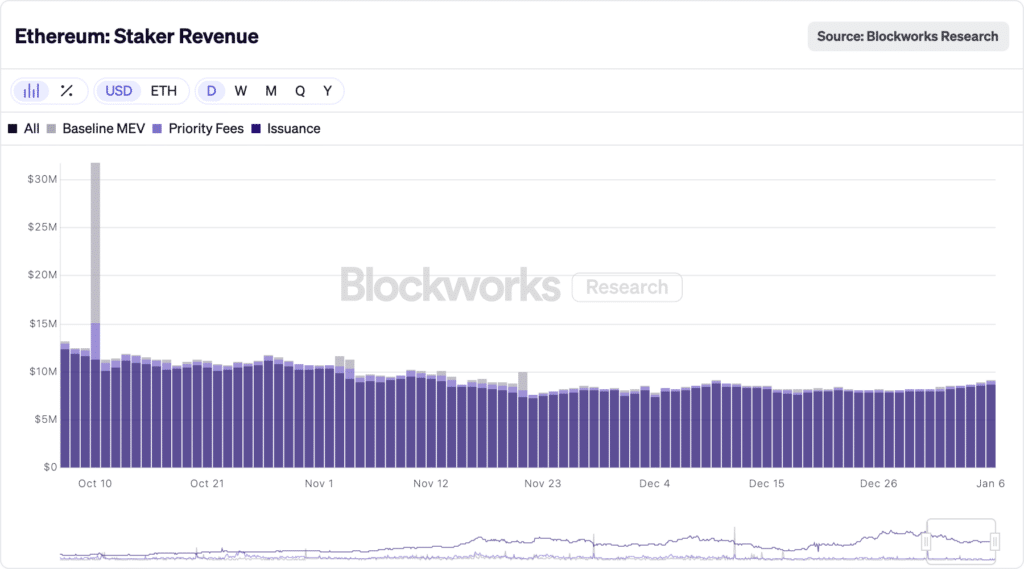
Meanwhile, Ethereum staker revenue trended lower but remained stable overall. Revenues started the quarter around $11-13 million per day in October, supported by occasional MEV and priority fee spikes, before easing through November as on-chain activity and speculative trading cooled. By mid-quarter, daily staker revenue settled closer to the $8-9 million range, reflecting a quieter network environment.
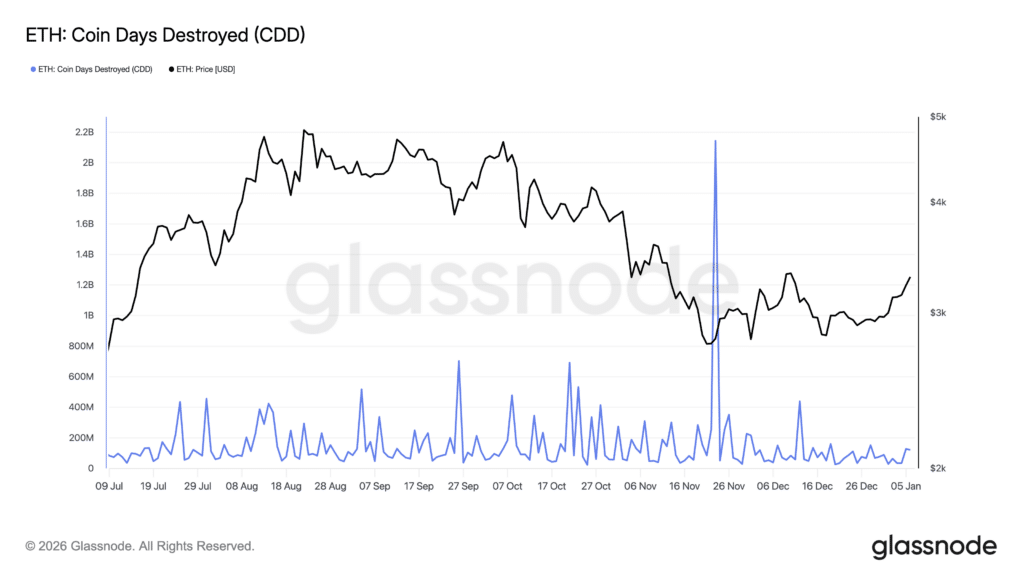
All of the data above pointed to the fact that ETH’s long-term holders were largely inactive, even as prices fell and consolidated. For most of the quarter, Coin Days Destroyed (CDD) metric stayed relatively low and steady, indicating that older ETH coins were not being moved in large amounts. This suggested that the price decline was driven more by short-term traders than by long-term investors exiting their positions.
Ethereum’s Derivatives Market Analysis
In Q4 2025, Ethereum’s derivatives market went through a clear leverage reset. Open interest dropped sharply in October as prices fell, driven by a large wave of long liquidations rather than fresh short positioning. This early shakeout flushed out overleveraged traders and removed excess risk from the system.
Following this reset, liquidations remained subdued and open interest stabilized through November and December, while ETH traded in a tighter range. The combination of lower leverage and reduced forced selling pointed to a more cautious market sentiment.
On the other hand, Ethereum’s funding rates stayed mostly close to neutral, showing a market that was pretty cautious of its move. After a sharp negative funding spike in early October, which lined up with the big price drop and long liquidations, funding quickly normalized.
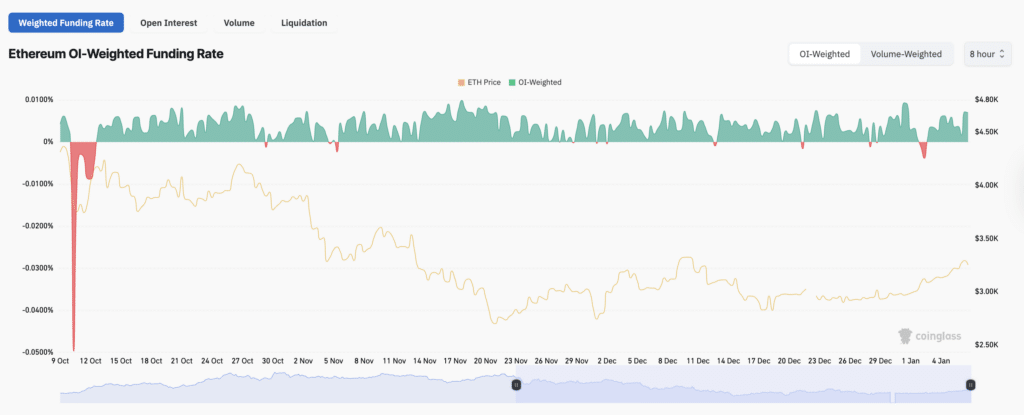
Through November and December, funding rates stayed positive with only brief dips. This suggests traders were no longer heavily leveraged. Several well-known industry figures remain positive on Ethereum’s long-term outlook. Tom Lee, chairman of BitMine, believes Ethereum’s upside is best seen by comparing its price to Bitcoin, and says ETH could rise sharply if Bitcoin goes up higher. Tom Lee said:
This is why we think the price ratio of Ethereum to Bitcoin is really the most important to watch. If Bitcoin gets to $250,000, which is our view, and Ethereum trades at its eight-year average ratio, that’s $12,000 Ethereum. If it gets to the 2021 high, that’s $22,000 Ethereum.
Key Crypto Sectors at a Glance
RWAs, Layer-1s, and utility-focused networks emerged as the strongest sectors in late 2025. Tokenized real-world assets expanded by about 260% over the year, making them one of the fastest-growing areas in crypto. High-performance Layer-1s and major altcoins like Solana and XRP benefited from ecosystem growth, ETF interest, and improved regulatory clarity, while smaller DeFi projects and memecoins fell out of favor as liquidity tightened.
Ethereum and its Layer-2 ecosystem stood out on fundamentals. DeFi activity remained strong, with total value locked nearing $165 billion, pointing to rising use of programmable, utility-driven networks rather than speculative tokens.
DeFi Market
- Total value locked across DeFi protocols hit its cycle high in October, with Ethereum, Solana, BNB Chain, and other major networks seeing strong capital inflows. This showed renewed investor confidence and reflected a shift of capital from Bitcoin into some high-ranking DeFi protocols like AAVE, Lido, MakerDAO, and Uniswap.
- Solana-based DEXs captured more DeFi trading share, with higher spot volumes than competing networks due to faster execution and lower costs.
- BNB Chain’s DeFi ecosystem grew strongly in Q4 2025, with total value locked rising above earlier highs and daily DEX trading volume climbing past $6 billion in October.
- DEX activity stayed a key growth driver for DeFi, with platforms like PancakeSwap, Uniswap, and newer perp DEXs continuing to see strong daily trading despite market volatility.
RWA Protocols
- Across the market, tokenized Real-World Assets (RWAs) grew from under $6 billion at the start of the year to over $17 billion by late 2025, marking one of the strongest performing segments in DeFi. DEXs to become the fifth-largest DeFi category by total value locked. RWAs now hold around $17 billion in TVL, up from about $12 billion at the end of 2024, showing how quickly this sector has grown.
- The surge in RWA TVL has been led by tokenized US Treasuries, private credit, and other real-world financial products being brought on-chain. These assets have shifted from experimental niches to core parts of DeFi, attracting more capital and institutional interest.
- This sector is creating bridge points between TradFi and blockchain, enabling physical and financial assets like bonds, real estate, and commodities to be traded digitally. As per market experts, this trend is expected to expand further in 2026.
Meme Coins
- The total meme coin market cap fell to $47.2 billion in November 2025, reflecting weaker overall demand. Dogecoin proved resilient despite rising competition and continued to dominate the market share, as many newer memecoins lost traction.
- Even without DOGE, dog-themed meme coins remained the largest segment, accounting for 39.5% of total meme coin market cap.
- Late 2024 hype around AI and the U.S. elections drove interest in themed meme coins like GOAT, FARTCOIN, BODEN, and later TRUMP in early 2025. While these categories have since seen sharp declines, they still rank among the top five meme coin sectors.
- Despite the rise of meme coin launchpads, most projects remain independent. Independent meme coins still control 86.2% of the total market cap.
- As per CoinGecko, at the start of 2025, the U.S. and India each made up around 20% of global meme coin interest. By November, U.S. interest rose to 30%, suggesting a shift in sentiment and regulatory outlook.
AI Tokens
- The aggregate market cap of AI-focused crypto tokens fell significantly toward the end of 2025, dropping about 28% to roughly $30.6 billion in December from earlier highs earlier in the quarter. Major projects like Bittensor (TAO) and NEAR were among those seeing declines.
- Despite heavy retail and institutional attention earlier in the year, the AI token sector underperformed relative to its hype in Q4.
- Despite a slow overall market, AI tokens such as FET showed signs of accumulation toward the end of Q4, driven by renewed interest from traders.
NFTs
- In 2025, the NFT market expanded rapidly in terms of supply, with the total number of unique NFTs minted rising by about 25% to roughly 1.34 billion assets across blockchains. However, this growing supply wasn’t matched by demand.
- Total NFT sales revenue fell about 37% year-over-year, dropping to approximately $5.6 billion, while the average price per NFT also declined, signaling weaker buyer interest compared to 2024.
- Ethereum remained the dominant chain for NFT activity, handling a large portion of NFT transactions, although total volume fell compared to previous years.
- CryptoPunks remains one of the most iconic NFT collections ever created, though trading interest and value have cooled compared with the peak boom years.
2026 Outlook for Bitcoin, Ethereum & Broader Crypto Market
As more capital flows in through regulated products like ETFs and blockchain use cases continue to expand, 2026 could be a year of steady growth, though volatility and macro risks are still expected.
- Growing Institutional Adoption & Regulation: Major banks such as Morgan Stanley launching crypto ETFs signal that traditional investors are becoming more comfortable with crypto. At the same time, countries like the UK are tightening reporting and tax rules for crypto platforms, showing a clear push toward stronger regulation. As more money flows in through regulated products like ETFs rather than small retail traders, the market could become more stable over time.
- Clearer Global Crypto Rules Ahead: Looking ahead, the U.S. is still waiting for clarity on several crypto-related bills, while other emerging economies are also working on their own regulatory frameworks. This suggests that 2026 could bring much clearer rules for the crypto market.
- Macro Factors & Bitcoin Price Outlook: U.S. tariff pressures and ongoing geopolitical tensions may support a more risk-on environment, potentially drawing retail investors back in and pushing Bitcoin higher. Analyst views remain divided, with some expecting Bitcoin to trade in a broad $120,000-$170,000 range, while others remain cautious and warn of a deeper bear market in 2026.
- More Deep-Pocketed Investors in 2026: Ethereum is expected to attract more interest from large financial institutions, especially through tokenization of real-world assets like stocks and property.
- Network Upgrades: The Hegota upgrade, planned for late 2026, is expected to improve scalability and reduce fees, making Ethereum cheaper and easier to use.
- Price Outlook Mixed But Positive: On prediction market Kalshi, traders see about a 40% chance of ETH reaching $5,000. On Polymarket, over 40% expect $5,000, while higher prices have lower odds. Some analysts that 99Bitcoins spoke to believe prices could rise to even $7,000 by year-end if adoption and institutional inflows continue.
Support Our Research
If you use any data or insights from this analysis, we kindly ask that you credit our Q3 2025 Crypto Market Report with a link.
Disclaimer: This content is for informational purposes only and should not be considered financial, investment, or trading advice. Please conduct your own research before making any financial decisions.
Thanks to Our Sponsor: Crypto.com

Crypto.com is a global crypto platform that helps people buy, sell, store, and use cryptocurrencies easily. Launched in 2016, it offers a simple mobile app and exchange for beginners and advanced users. This exchange supports many popular coins and is known for its strong security features. It also offers crypto cards, staking, earning programs, NFTs, and DeFi services. One of its main goals is to make crypto easy to use in everyday life. With a focus on regulation and user safety, Crypto.com continues to dominate the market.
The post 99Bitcoins’ Q4 2025 State of Crypto Market Report appeared first on 99Bitcoins.

99Bitcoins’ Crypto Reports
99Bitcoins
[crypto-donation-box type=”tabular” show-coin=”all”]