Spot The Odd One Out: Life Expectancy Vs Healthcare Spending
As Warren Buffett popularized: “Price is what you pay, value is what you get”.
As Visual Capitalist’s Jeff Desjardins details below, just because someone pays the most, doesn’t mean that they extract the biggest payoff from a product or service.
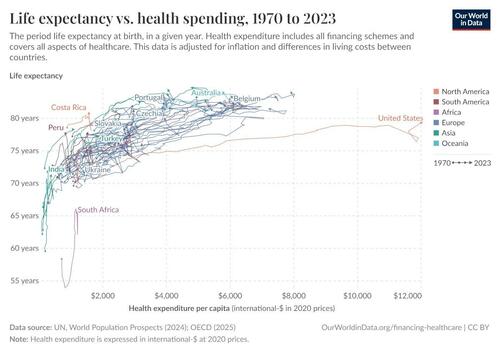
Today’s visual from Our World in Data that compares life expectancy with healthcare spending per capita hints at exactly this paradox.
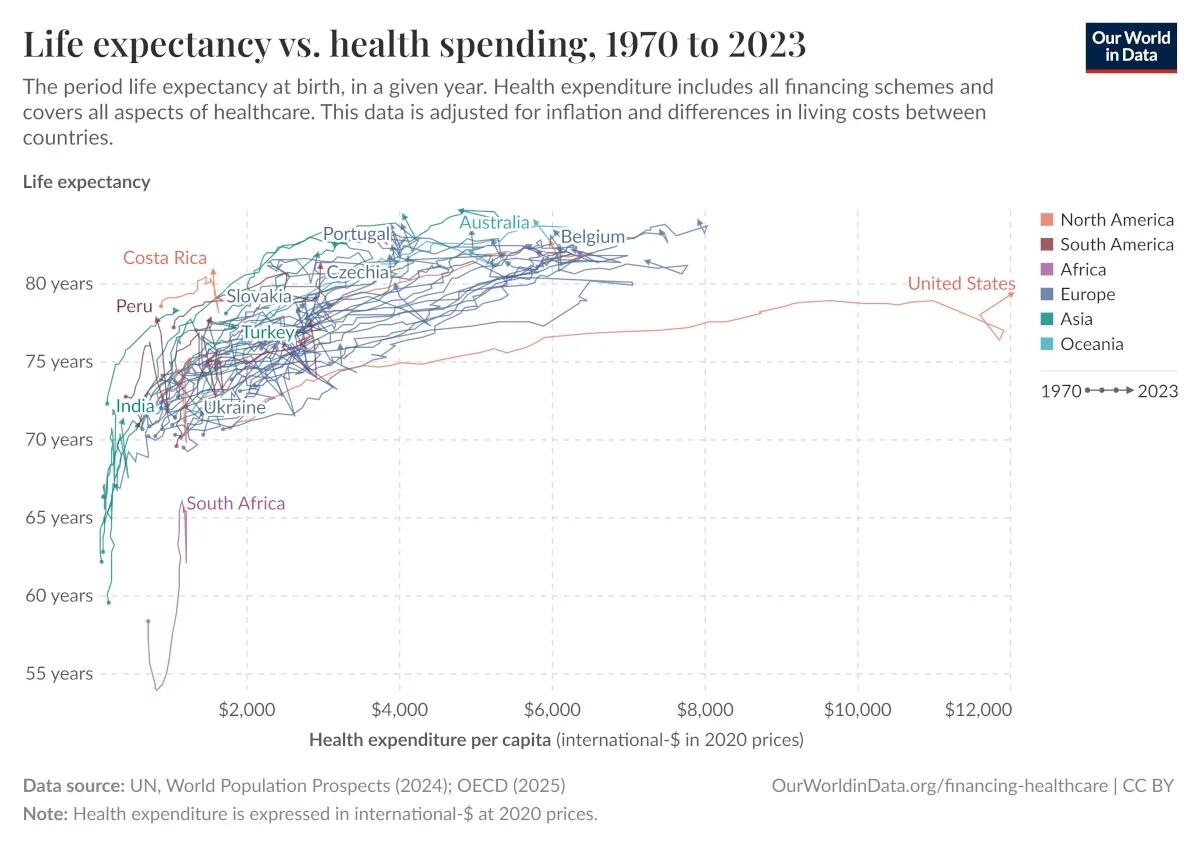
The Data on Life Expectancy vs. Healthcare Spending
Below is the data for 51 countries for the year 2023:
| Rank | Country | Life expectancy (2023) | Health expenditure per capita (2023) |
|---|---|---|---|
| 1 | 🇯🇵 Japan | 84.71 | $4,806 |
| 2 | 🇰🇷 South Korea | 84.33 | $4,055 |
| 3 | 🇨🇭 Switzerland | 83.95 | $7,930 |
| 4 | 🇦🇺 Australia | 83.92 | $5,778 |
| 5 | 🇮🇹 Italy | 83.72 | $4,046 |
| 6 | 🇪🇸 Spain | 83.67 | $3,901 |
| 7 | 🇫🇷 France | 83.33 | $6,036 |
| 8 | 🇳🇴 Norway | 83.31 | $7,424 |
| 9 | 🇲🇹 Malta | 83.30 | $4,941 |
| 10 | 🇸🇪 Sweden | 83.26 | $6,204 |
| 11 | 🇮🇸 Iceland | 82.69 | $5,228 |
| 12 | 🇨🇦 Canada | 82.63 | $5,981 |
| 13 | 🇮🇪 Ireland | 82.41 | $5,689 |
| 14 | 🇮🇱 Israel | 82.41 | $3,154 |
| 15 | 🇵🇹 Portugal | 82.36 | $3,906 |
| 16 | 🇱🇺 Luxembourg | 82.23 | $6,078 |
| 17 | 🇳🇱 Netherlands | 82.16 | $6,273 |
| 18 | 🇧🇪 Belgium | 82.12 | $6,123 |
| 19 | 🇳🇿 New Zealand | 82.09 | $4,938 |
| 20 | 🇦🇹 Austria | 81.96 | $6,361 |
| 21 | 🇩🇰 Denmark | 81.93 | $5,823 |
| 22 | 🇫🇮 Finland | 81.91 | $5,375 |
| 23 | 🇬🇷 Greece | 81.86 | $2,943 |
| 24 | 🇨🇾 Cyprus | 81.65 | $3,869 |
| 25 | 🇸🇮 Slovenia | 81.60 | $4,118 |
| 26 | 🇩🇪 Germany | 81.38 | $7,248 |
| 27 | 🇬🇧 United Kingdom | 81.30 | $5,413 |
| 28 | 🇨🇱 Chile | 81.17 | $2,964 |
| 29 | 🇨🇷 Costa Rica | 80.80 | $1,565 |
| 30 | 🇨🇿 Czechia | 79.83 | $3,943 |
| 31 | 🇺🇸 United States | 79.30 | $12,023 |
| 32 | 🇪🇪 Estonia | 79.15 | $2,921 |
| 33 | 🇵🇱 Poland | 78.63 | $3,125 |
| 34 | 🇭🇷 Croatia | 78.58 | $2,751 |
| 35 | 🇸🇰 Slovakia | 78.34 | $2,672 |
| 36 | 🇨🇳 China | 78.20 | $1,086 |
| 37 | 🇵🇪 Peru | 77.74 | $817 |
| 38 | 🇨🇴 Colombia | 77.73 | $1,537 |
| 39 | 🇦🇷 Argentina | 77.40 | $2,850 |
| 40 | 🇹🇷 Turkey | 77.16 | $1,846 |
| 41 | 🇭🇺 Hungary | 77.02 | $2,613 |
| 42 | 🇱🇻 Latvia | 76.19 | $2,494 |
| 43 | 🇱🇹 Lithuania | 76.03 | $3,224 |
| 44 | 🇷🇴 Romania | 75.94 | $2,373 |
| 45 | 🇧🇬 Bulgaria | 75.64 | $2,612 |
| 46 | 🇲🇽 Mexico | 75.07 | $1,244 |
| 47 | 🇧🇷 Brazil | 74.87 | $1,661 |
| 48 | 🇮🇳 India | 71.70 | $290 |
| 49 | 🇺🇦 Ukraine | 71.63 | $1,429 |
| 50 | 🇮🇩 Indonesia | 71.15 | $376 |
| 51 | 🇿🇦 South Africa | 65.45 | $1,218 |
| — | Average | 79.74 | $3,986 |
The clear takeaway is that while most high and upper-middle income countries cluster around the same trajectory, the United States is a clear outlier.
On average, the countries on the above list have a life expectancy of 79.74 years for a cost of $3,986 per person, while the U.S. has a life expectancy of 79.3 and spend of $12,023 per person.
Peer countries (Canada, UK, Germany, Japan, France, Italy) spend about half of what the U.S. does on healthcare per capita on average, but all have better life expectancy outcomes.
Why is the U.S. an Outlier?
While the U.S. excels in advanced and specialized medical care, life expectancy outcomes are held back by lifestyle and social factors rather than clinical capability.
Higher rates of obesity, chronic disease, opioid overdoses, gun violence, and traffic fatalities all weigh on average lifespan.
At the same time, healthcare access is uneven, with large gaps by income, race, and geography. As a result, additional spending often goes toward higher prices and end-of-life care, producing diminishing returns in overall life expectancy.
View the highest and lowest life expectancy rates around the world in this map.
Tyler Durden
Wed, 01/07/2026 – 12:35
ZeroHedge News
[crypto-donation-box type=”tabular” show-coin=”all”]