System calls are how user programs talk to the operating system. They include opening files, reading the current time, creating processes, and more. They’re unavoidable, but they’re also not cheap.
If you’ve ever looked at a flame graph, you’ll notice system calls often show up as hot spots. Engineers spend a lot of effort cutting them down, and whole features such as io_uring for batching I/O or eBPF for running code inside the kernel exist just to reduce how often programs have to cross into kernel mode.
Why are they so costly? The obvious part is the small bit of kernel code that runs for each call. The bigger cost comes from what happens around it: every transition into the kernel makes the CPU drop its optimizations, flush pipelines, and reset predictor state, then rebuild them again on return. This disruption is what makes system calls much more expensive than they appear in the source code.
In this article, we’ll look at what really happens when you make a system call on Linux x86-64. We’ll follow the kernel entry and exit path, analyse the direct overheads, and then dig into the indirect microarchitectural side-effects that explain why minimizing system calls is such an important optimization.
CodeRabbit: Free AI Code Reviews in CLI (Sponsored)
As developers increasingly turn to CLI coding agents like Claude Code for rapid development, a critical gap emerges: who reviews the AI-generated code? CodeRabbit CLI fills this void by delivering senior-level code reviews directly in your terminal, creating a seamless workflow where code generation flows directly into automated validation. Review uncommitted changes, catch AI hallucinations, and get one-click fixes – all without leaving your command line. It’s the quality gate that makes autonomous coding truly possible, ensuring every line of AI-generated code meets production standards before it ships.
Background on System Calls
Let’s start with a quick overview of system calls. These are routines inside the kernel that provide specific services to user space. They live in the kernel because they need privileged access to registers, instructions, or hardware devices. For example, reading a file from disk requires talking to the disk controller, and creating a new process requires allocating hardware resources. Both are privileged operations, which is why they are system calls.
Calling a system call requires a special mechanism to switch execution from user space to kernel space. On x86-64 this is done using the syscall instruction, where you place the syscall number in rax and the arguments in registers (rdi, rsi, rdx, r10, r9, r8), then invoke syscall:
# set args for calling read syscall
movq $1, %rax
movq $1, %rdi
movq $buf, %rsi
movq $size, %rdx
syscall # we enter the kernel here
movq %rax, %rbx
On encountering this instruction, the processor switches to kernel mode and jumps to the registered syscall entry path. The kernel completes the context switch (switching the page tables and stack) and then jumps to the specific syscall implementation.
When the syscall finishes, it places the return value in rax and returns. Returning requires another privilege mode switch, reversing everything done on entry: restoring the user page table, stack, and registers.
The following diagram illustrates the sequence of steps required to execute a system call (read in this case).
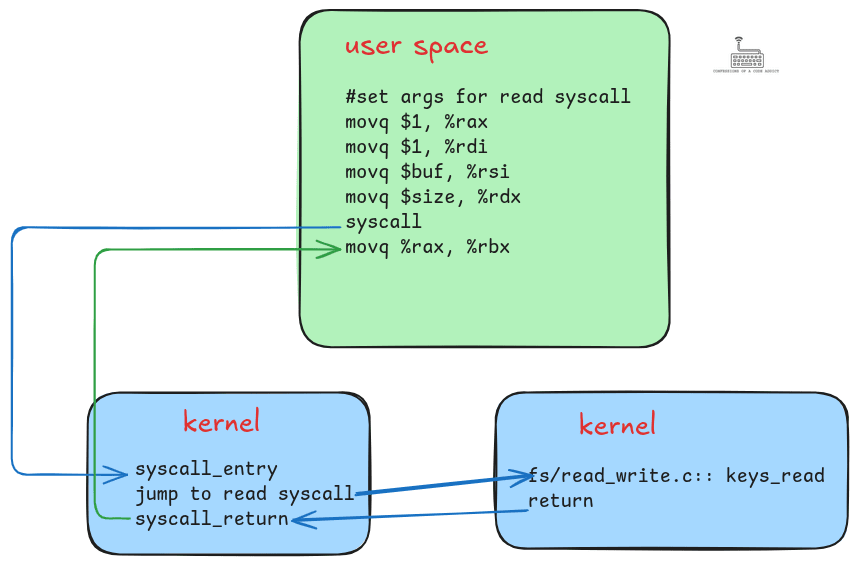
read system call: user space sets up arguments and invokes syscall, control transfers to the kernel entry handler, the kernel executes the system call (keys_read), and then returns control back to user space.In the figure:
-
User space code sets up arguments for the
readsystem call. -
It invokes the system call using the
syscallinstruction. -
The instruction switches to kernel mode and enters the syscall entry handler, where the kernel switches to its own page table and stack.
-
The kernel then jumps to the implementation of the
readsystem call. -
After returning, the kernel restores the user space page table and stack, then control resumes at the next user instruction.
Now that we have this high-level overview, let’s look inside the Linux kernel’s syscall handler to understand each step in more detail.
Inside the Linux Syscall Handler
When a system call is invoked, the CPU jumps into the kernel’s designated system call handler. The following diagram shows the Linux kernel code for this handler for the x86-64 architecture from the file entry_64.S. In the diagram, you can see the set of steps the kernel needs to perform before it can actually execute the system call. Let’s briefly discuss each of these.
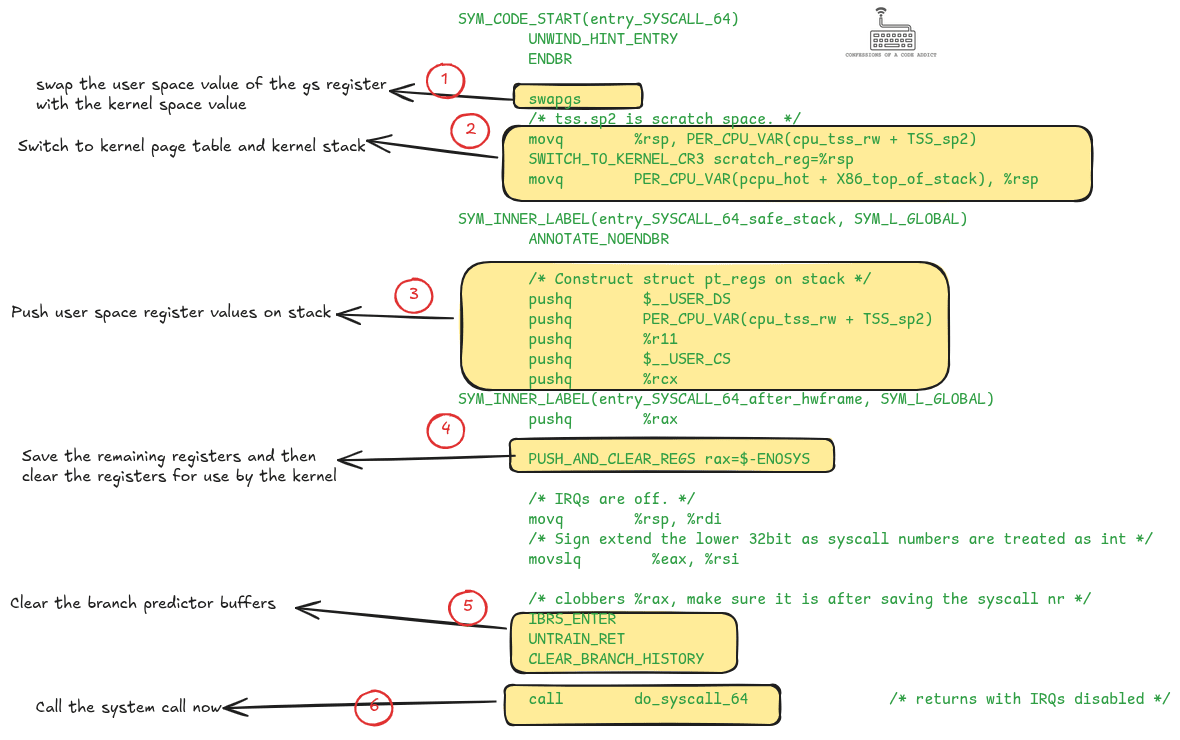
entry_64.S), annotated to show the steps the kernel performs before invoking the system call.Swapping the GS Register
GS is a segment register in the x86 architecture. In user space it is primarily used for thread-local storage (TLS). In kernel space it holds per-cpu variables, such as a pointer to the currently executing task. So, the first thing that the kernel does is restore the kernel mode value of the GS register.
Switching to Kernel Page Table and Kernel Stack
The Linux kernel has its own page table with mappings for kernel memory pages. To be able to access its memory it must restore this page table. It does this by calling the SWITCH_TO_KERNEL_CR3 macro.
On x86, the CR3 control register is designated to store the address of the root of the page table. This is why the macro for switching page tables is called
SWITCH_TO_KERNEL_CR3.
Separately, the kernel has its own fixed-size stack for executing kernel-side code. At this point the rsp register still points to the user space stack, so the kernel saves it in a scratch space and then restores its own stack pointer from a per-cpu variable.
When returning from the system call, the kernel restores the user page table and stack by reversing these operations. This code is not shown in the diagram but happens right after the “call do_syscall_64” step.
Saving User Space Registers
At this time, the CPU registers still contain the values they had while executing user space code. They will be overwritten when the kernel code executes, to avoid that from happening, the kernel saves the values on the kernel stack. After that it sanitizes those registers for security. All of this can be seen in boxes 3 and 4 in the diagram.
Mitigations Against Speculative Execution Attacks
The next three steps in the code are:
-
Enabling IBRS (indirect branch restricted speculation)
-
Untraining the return stack buffer
-
Clearing the branch history buffer
These are there to mitigate against speculative execution attacks, such as spectre (v1 and v2), and retbleed. Speculative execution is an optimization in modern processors where they predict the outcome of branches in the code and speculatively execute instructions at the predicted path. When done accurately, this significantly improves the performance of the code.
However, vulnerabilities have been found where a malicious user program may train the branch predictor in ways that cause the CPU to speculatively execute along attacker‑chosen paths inside the kernel. While these speculative paths do not change the logical flow of kernel execution, they can leak information through microarchitectural side‑channels such as the cache.
These mitigations prevent user‑controlled branch predictor state from influencing speculative execution in the kernel. But, these also come at a great performance cost. We will revisit these in detail later, when discussing the impact of system calls on branch prediction.
Executing the System Call and Returning Back to User Space
After all of this setup, the kernel finally calls the function do_syscall_64. This is where the actual system call gets invoked. We will not look inside of this function because our focus is on performance impact rather than a walkthrough of kernel code.
Once the system call is done, the do_syscall_64 function returns. The kernel then restores the user space state, including registers, page table, and stack, and returns control back to user space. The following diagram shows the code after the do_syscall_64 call to highlight this part.
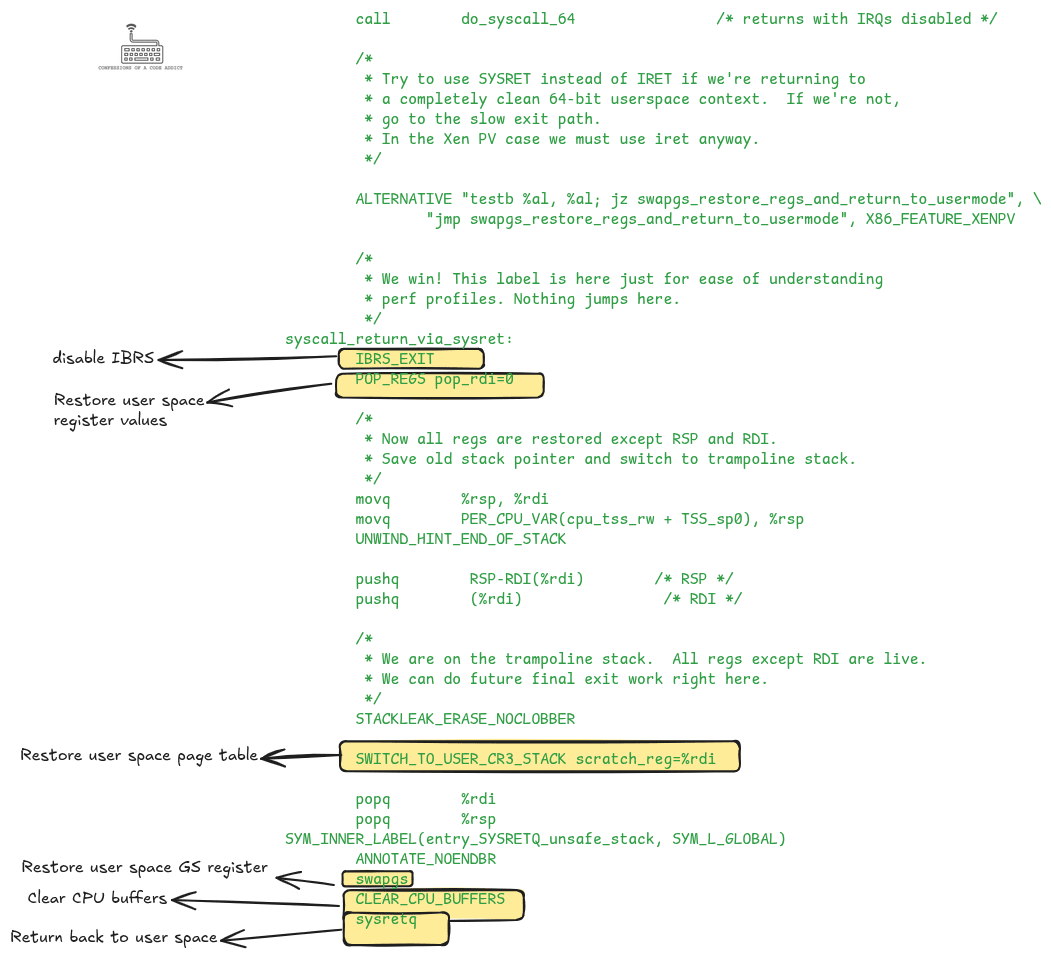
entry_64.S), showing how the kernel restores user registers, page tables, and state before returning control to user space.Now that we have seen all the code the kernel executes to enter and exit a system call, we are ready to discuss the overheads introduced. There are two categories:
-
Direct overhead from the code executed on entry and return.
-
Indirect overhead from microarchitectural side-effects (e.g. clearing the branch history buffer and return stack buffer).
The major focus of this article is on discussing the indirect overhead induced due to system calls. But before we go any further, let’s do a quick benchmark to measure the impact of the direct overheads.
Direct Overhead of System Calls
Direct overhead is largely fixed across all system calls, since each system call must perform the same entry and exit steps. We can do a rough measurement of this overhead with a simple benchmark by comparing the number of cycles taken to execute the clock_gettime system call in the kernel versus executing it in the user space.
The clock_gettime system call reads a system clock, such as the realtime clock (seconds since the Unix epoch) or the monotonic clock (seconds since kernel boot). It is very frequently used in software. For example, Java’s System.currentTimeMillis() and Python’s time.time() and time.perf_counter() use it under the hood.
Because system calls are expensive, Linux provides an optimization called vDSO (virtual dynamic shared object). This is a user-space shortcut for selected system calls where the kernel maps the system call’s code into each process’s address space so that they can be executed like a normal function call, avoiding kernel entry.
So, we can create a benchmark that measures the time taken to execute clock_gettime in the user space using vDSO and compare it against the time taken inside the kernel using the syscall interface. The following code shows the benchmarking program.
#define _GNU_SOURCE
#include <sys/syscall.h>
#include <unistd.h>
#include <stdint.h>
#include <stdio.h>
#include <time.h>
#include <x86intrin.h>

int main() {
  const int ITERS = 100000;
  uint32_t cpuid;
  struct timespec ts;

  // Warm up both syscall and libc versions
  for (int i = 0; i < 10000; i++) {
    syscall(SYS_clock_gettime, CLOCK_MONOTONIC, &ts);
    clock_gettime(CLOCK_MONOTONIC, &ts);
  }

  // Test 1: Direct syscall interface
  _mm_lfence();
  uint64_t start1 = __rdtsc();
  long sink1 = 0;
  for (int i = 0; i < ITERS; i++) {
    long ret = syscall(SYS_clock_gettime, CLOCK_MONOTONIC, &ts);
    sink1 += ret + ts.tv_sec + ts.tv_nsec; // use the results to prevent optimization
  }
  uint64_t end1 = __rdtscp(&cpuid);
  _mm_lfence();

  // Test 2: libc clock_gettime
  _mm_lfence();
  uint64_t start2 = __rdtsc();
  long sink2 = 0;
  for (int i = 0; i < ITERS; i++) {
    int ret = clock_gettime(CLOCK_MONOTONIC, &ts);
    sink2 += ret + ts.tv_sec + ts.tv_nsec; // use the results to prevent optimization
  }
  uint64_t end2 = __rdtscp(&cpuid);
  _mm_lfence();

  // Prevent dead-code removal
  if (sink1 == 42 || sink2 == 42) fprintf(stderr, "xn");

  double cycles_per_syscall = (double)(end1 - start1) / ITERS;
  double cycles_per_libc = (double)(end2 - start2) / ITERS;

  printf("Direct syscall cycles per call ~ %.1fn", cycles_per_syscall);
  printf("Libc wrapper cycles per call ~ %.1fn", cycles_per_libc);
  printf("Difference ~ %.1f cycles (%.1f%% %s)n",
         cycles_per_libc - cycles_per_syscall,
         100.0 * (cycles_per_libc - cycles_per_syscall) / cycles_per_syscall,
         cycles_per_libc > cycles_per_syscall ? "slower" : "faster");

  return 0;
}
A note on rdtsc: Normally, you would use
clock_gettime()to measure timings. But here we are benchmarkingclock_gettime()itself, so we need something more precise.rdtscis an x86 instruction that reads the value of a 64‑bit timestamp counter (TSC) in the CPU. This counter ticks at a fixed frequency (e.g. 2.3 GHz on my machine). By measuring its value before and after, we can know how many cycles an operation took.
The program produces the following output on my laptop:
➜ ./clock_gettime_comparison
Direct syscall cycles per call ~ 1428.8
Libc wrapper cycles per call ~ 157.0
Difference ~ -1271.9 cycles (-89.0% faster)
The vDSO version is an order of magnitude faster, showing how costly the syscall entry/exit path is compared to a plain function call.
We should take this estimate with a grain of salt because in the benchmark we are measuring inside a loop, and the performance of the loop itself can suffer from the indirect side‑effects of entering and exiting the kernel, which is our next topic.
While this benchmark isolates direct overhead, real‑world performance also suffers from indirect costs due to CPU microarchitectural effects. Let’s explore those next.
Indirect Overhead of System Calls
System calls also incur indirect costs, because the kernel’s entry path disturbs the CPU’s microarchitectural state. These side-effects impact the microarchitectural state of the process in the CPU and the loss of this state can introduce transient degradation in the performance of the user space code.
At the microarchitecture level, the CPU implements several optimizations such as instruction pipelining, superscalar execution and branch prediction. These are designed to improve the instruction throughput of the program, i.e., how many instructions the CPU can execute each cycle. A higher throughput means faster program execution.
It can take a few cycles for the CPU to get to a steady state where these optimizations start to pay off, but making system calls can lead to the loss of this state and a drop in the performance of the program.
We will cover the indirect costs of system calls by discussing the different components of the microarchitecture that are impacted, starting from the instruction pipeline, followed by the branch predictor buffers.
Effect on the Instruction Pipeline
We didn’t see any code in the Linux kernel which touches the instruction pipeline, rather this is done by the CPU itself. Before switching to kernel mode, the CPU drains the instruction pipeline to ensure that the user space code does not interfere when the kernel code executes. This impacts the performance of the user space code when the system call returns. To understand how, we need to revisit the basics of instruction pipelining.
CPUs have multiple execution resources, such as registers, execution units, load and store buffers etc. To use all of these effectively, it is necessary that they executes multiple program instructions in parallel, this is made possible through instruction pipelining and superscalar architecture.
Instruction pipelining breaks down the execution of an instruction into several stages, like the assembly pipeline in a factory. An instruction moves from one stage to the next in each CPU cycle, enabling the CPU to start executing one new instruction each cycle.
For example, the following diagram shows a 5-stage pipeline. You can see that it takes five instructions for the pipeline to fill completely, and for the first instruction to retire. After this stage, the pipeline is in a steady state, and it can provide a throughput of one instruction per cycle. This is a very simplistic example, modern x86 processors have much deeper pipelines, e.g. 20-30 cycles.

Modern processors are also superscalar. They have multiple such pipelines to issue and execute multiple new instructions each cycle. For example, a 4-wide processor can start executing up to 4 new instructions each cycle and it can retire up to 4 new instructions each cycle. If such a CPU has a pipeline depth of 20, then it can have up to 80 instructions in flight in a steady state.
This means that the processor is normally busy executing dozens of user-space instructions in parallel. But when a system call occurs, the CPU must first ensure all pending user instructions finish before it can jump into the kernel.
So, when the system call returns back to the user space, you can imagine that the instruction pipeline is almost empty because the CPU did not allow the instructions following syscall to enter the pipeline. At this point the pipeline has to start almost from scratch, and it can again take a while until the pipeline reaches a steady throughput again.
Contrast this with the scenario where no system call occurs: the CPU remains in its steady state, pipelines stay full, and instruction throughput stays high. In other words, a single system call can derail the momentum of dozens of in‑flight instructions.
On x86-64, the syscall instruction is used to execute a system call. The Intel manual has this note about it:
“Instruction ordering: Instructions following a SYSCALL may be fetched from memory before earlier instructions complete execution, but they will not execute (even speculatively) until all instructions prior to the SYSCALL have completed execution (the later instructions may execute before data stored by the earlier instructions have become globally visible).”
This confirms that the CPU drains the pipeline before transferring control to the kernel.
Effect on Branch Prediction
The next major indirect impact system calls have on user space performance is through the clearing of the branch predictor buffers. These can be grouped as three mitigations the kernel applies that we saw in the kernel code above.
-
Clearing the branch history buffer
-
Untraining the return stack buffer
-
Enabling/disabling the IBRS
The first two of these have a profound indirect impact on user code performance. The enabling/disabling of IBRS does not impact user space performance, rather only adds a direct overhead to syscall execution. However, I will discuss this here because logically it goes with the topic of branch prediction. In this section, we will first review branch prediction and then talk about each of these.
Understanding Branch Prediction
Instruction pipelining and superscalar execution enables CPUs to execute multiple instructions in parallel, and they execute these instructions out-of-order.
When the CPU comes across a branching instruction, such as an if condition, it may not know the result of the condition because those set of instructions may still be executing. If the CPU waits for those instructions to finish to know the branch outcome, the pipeline can be stalled for a long time, which means poor performance.
To optimize this, the CPUs come with a feature called the branch predictor that can predict the target address of these branches based on past branching patterns. This enables the CPU to speculatively execute the instruction from the predicted address and stay busy. If the prediction turns out to be correct, then the CPU saves a lot of cycles and instruction throughput remains high.
However, when the prediction is wrong, the CPU has to discard the results of these speculatively executed instructions, flush the instruction pipeline, and fetch the instructions from the right address. This can cost 20-30 cycles on modern CPUs (depending on the depth of the pipeline).
Clearing the Branch History Buffer
We saw in the kernel code that it invokes the macro CLEAR_BRANCH_HISTORY which clears the branch history buffer (BHB).
The BHB is a buffer in the branch predictor that learns the branching history patterns at a global level. This helps the branch predictor predict the outcomes of deeply nested and complex branching patterns more accurately. You can think of it as remembering the last few intersections you passed to better predict where you’ll turn next.
But it can take a while for the BHB to collect enough history for the branch predictor to generate accurate predictions. So, whenever you execute a system call in your code, if the kernel clears the BHB, you lose all that state. As a result, your user space code may experience an increased rate of branch mispredictions after returning from the system call. This can significantly degrade the performance of user space applications.
Note on recent CPUs: This clearance of BHB was added to the kernel as a mitigation against speculative execution attacks, such as Spectre V2. In recent years, CPU vendors have introduced hardware mitigations which obviate the need for the kernel to clear the BHB. For example, the Intel advisory says that if your CPU comes with the “enhanced IBRS” (we discuss IBRS below) feature, then there is no need to clear the BHB. So, not all CPUs suffer degraded performance due to this.
If you want to check whether your kernel clears the BHB, you can check the lscpu output. If you see “
BHI SW loop” in the vulnerability section, it means that the kernel clears the BHB during system calls.Also, if you believe that you will never execute untrusted code, you can manually disable the mitigation through a boot time flag.
Untraining the Return Stack Buffer
Next in the line is untraining of the return stack buffer (RSB). The RSB is another buffer in the branch predictor that is used to predict the return address of function calls.
But why does it need to predict the return address? It again comes down to out-of-order execution. The CPU may want to execute the return instruction even though other instructions of the function may still be executing. At this point, the CPU does not know the return address. The return address is stored on the process’s stack memory, but accessing memory is slow. So, the CPU uses the RSB to predict the return address.
On every function call, the CPU pushes the return address into the RSB. While executing the return instruction, the CPU pops this buffer and jumps to that address. Because this buffer right in the CPU, it is very fast to access.
However, this also led to vulnerabilities such as Retbleed. In this attack, carefully chosen user‑space code could influence how the CPU predicted kernel return addresses, so that the CPU speculatively executed instructions at the wrong place inside the kernel. While this speculative execution did not change the actual kernel logic, it could leak information through side‑channels. To prevent this, the kernel untrains the RSB on entering the kernel.
Untraining the RSB impacts the performance of the user space code when the system call returns because now the RSB does not have the state. Without a trained RSB, the CPU falls back to a slower indirect branch predictor which may have higher chances of making a mistake.
Note on CPUs Impacted: The kernel does not clear the RSB for all the CPU models. The vulnerabilities that require clearing the RSB (retbleed and SRSO) have only been known to impact AMD CPUs. Also, if your CPU has hardware mitigations, such as enhanced IBRS, then the kernel does not perform this (the
UNTRAIN_RETmacro becomes a noop on such devices).Again, the kernel allows you to disable the mitigation but do this only when you are sure that you will never run untrusted code.
IBRS Entry and Exit
Finally, let’s talk about indirect branch restricted speculation (IBRS). We saw that the kernel executes IBRS_ENTER on entering the syscall and IBRS_EXIT while returning back. So, what is IBRS and what is its impact on performance?
IBRS is a hardware feature which restricts the indirect branch predictor when executing in kernel mode. Effectively, it prevents the user space training of the indirect branch predictor from having any effect on indirect branch prediction inside the kernel.
Indirect branches are those branches in code where the target address is not part of the instruction but is known only at runtime. A common example is calling through a function pointer in C (e.g., (*fp)()), where the actual target depends on which function the pointer holds at that moment. Another example is a virtual function call in C++ or a jump table generated for a large switch statement. In all these cases, the CPU can use the indirect branch predictor to guess the likely target address based on past branching history.
When the Spectre and related vulnerabilities were found, one of the attack vectors involved tricking the CPU into mispredicting indirect branch targets inside the kernel. By influencing the branch predictor state from user space, attackers could cause the CPU to speculatively execute instructions at unintended locations in the kernel. It could lead to leak of sensitive kernel data through side-channels such as the cache.
The mitigation for this attack is to restrict the indirect branch predictor when executing in kernel mode via the IBRS mechanism. Enabling and disabling IBRS itself doesn’t have any impact on the performance of the user space code, but the act of executing extra instructions to do this during each system call adds overhead.
However, recent CPUs have a feature called enhanced IBRS which automatically enables IBRS when switching to kernel mode. On such devices, the IBRS_ENTER and IBRS_EXIT macros in the kernel become a noop.
Together, these mitigations explain why the indirect cost of system calls can vary significantly across CPU generations and configurations. In practice, this means a single system call can not only drain the pipeline but also leave the branch predictor partially blind, forcing the CPU to relearn patterns and slowing down your code until it recovers. The important point is that the true cost of a system call is not just the handful of instructions executed in the kernel, but also the disruption it causes to the CPU’s optimizations. This makes system calls far more expensive than they look on the surface, and why minimizing them can be such a powerful optimization strategy. However, slowly CPU vendors are adding hardware mitigations which is making these software-based mitigations obsolete and reducing the performance overheads.
Practical Ways to Reduce System Calls
So what can you do as a developer? A few practical ideas:
-
Use vDSO: For calls like
clock_gettime, prefer the vDSO path to avoid kernel entry. -
Cache cheap values: Some values obtained through system calls rarely change during a program’s lifetime. If you can safely cache them once and reuse, you can avoid repeated system calls.
-
Optimize I/O System Calls: There are various strategies and patterns that you can use to optimize I/O related system calls. For example:
-
Prefer buffered I/O instead of raw read/write system calls
-
Use scatter/gather operations like
readv/writevto batch multiple buffers -
If your system allows, use
mmapinstead of repeated read/write calls.
-
-
Batch operations: Interfaces like io_uring let you submit many I/O requests to a shared queue in user space, which the kernel can then process in batches. This reduces the number of times your program needs to cross into the kernel.
-
Push work into the kernel: With eBPF it is increasingly possible to move parts of application logic into the kernel itself. Beyond traditional use cases like packet filtering, newer frameworks let you offload tasks such as policy enforcement, monitoring, and even parts of data processing. In these cases, instead of making repeated system calls, the user program loads small programs into the kernel that run directly when events occur, avoiding crossings altogether.
None of these tricks are magic, but they all follow the same principle: fewer crossings means less disruption. Every time you avoid a system call, you’re saving not just a function call into the kernel, but also the hidden costs of the CPU recovering its state.
Wrapping Up
We’ve gone through a lot of detail for what looks like just a small stretch of kernel code. The point is simple: the cost of a system call goes beyond the small number of instructions that execute in the kernel. It disrupts the CPU’s rhythm by draining pipelines, resetting predictors, and forcing everything to start fresh. That’s why they show up as hot spots in profiles and why people try so hard to avoid them.
The strategies we looked at earlier (vDSO, caching, optimizing I/O, batching with io_uring, and pushing work into the kernel) are all ways to cut down on this disruption. They won’t remove the cost of system calls entirely, but they can make the difference between code that spends most of its time waiting on the kernel and code that keeps the CPU running at full speed.
System calls are the interface to the kernel and the hardware. They are necessary, but they come at a cost. Understanding and managing that cost is a key part of writing faster software.

Confessions of a Code Addict
[crypto-donation-box type=”tabular” show-coin=”all”]


