How LLMs can used in a knowledge extraction and visualization pipeline
Introduction
Note: I’m not an expert on this topic, I selected this as project to explore and learn about about this topic. If you have any feedback or suggestions to improve this, feel free to share, all constructive or otherwise feedback is welcome.
Knowledge graphs offer a powerful way to represent information. They consist of entities (nodes) and the relationships (edges) between them, making it easier to see how things connect than if they were simply viewed as unstructured text.
Traditionally, building a knowledge graph from raw text is not easy. It requires identifying entities and their relationships, hand-coded extraction rules, or specialized machine-learning models. However, Large Language Models (LLMs) are very flexible and can be used for this purpose. LLMs can read free-form text and output structured information, so it’s possible as we’ll see in this article to use them as part of an automated pipeline to create knowledge graphs.
In this article, we’ll explore a learning project that I created with the goal to create an LLM-powered pipeline that takes unstructured text and transforms it into an interactive knowledge graph webpage. All the code for this project is located the AI-Knowledge-Graph project repository.
Simple Example
The following is a simple example of what this project does. When provided the following unstructured text as input:
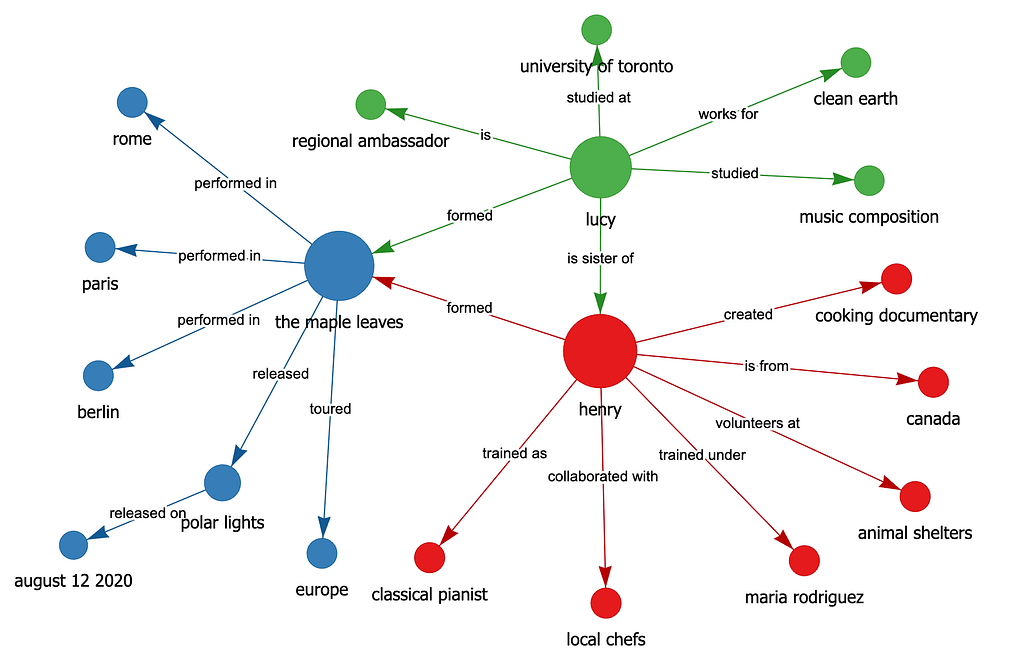
Henry, a talented musician from Canada, originally trained as a classical pianist under renowned conductor Maria Rodriguez. Henry later formed a rock band called The Maple Leaves with his sister Lucy, who studied music composition at the University of Toronto. The Maple Leaves released their debut album, Polar Lights, on August 12, 2020, earning critical acclaim for blending classical and rock influences. Lucy also pursued environmental activism and joined Clean Earth as a regional ambassador, where she campaigned for stricter wildlife protection laws. Henry was inspired by Lucy’s passion for charity work, so he started volunteering at local animal shelters in his hometown. Although Henry and Lucy initially struggled with creative differences, they eventually found harmony in combining Lucy’s classical compositions with Henry’s rock guitar riffs. The Maple Leaves toured across Europe in 2021, performing sold-out shows in major cities like Paris, Berlin, and Rome. During the tour, Henry developed a keen interest in international cuisine and collaborated with local chefs to film a short documentary on regional cooking techniques.
The ai-knowledge-graph utility will use the configured LLM of your choice to extract knowledge from the above text and create an knowledge graph html as output that will look similar to the following image:
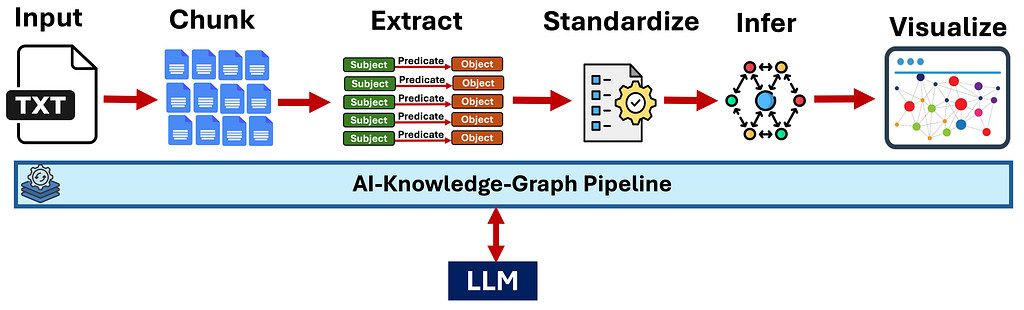
High-level description of how it works:
- Text Chunking: Automatically splits large documents into manageable chunks for processing
- Knowledge Extraction: An LLM then identifies and extracts the Subject–Predicate–Object triples (facts) in each chunk.
- Entity Standardization: Mentions of the same entity (e.g., “AI” and “artificial intelligence”) are unified to a single name.
- Relationship Inference: Additional relationships are inferred — both via simple logical rules (e.g., transitivity) and LLM reasoning to bridge disconnected subgraphs.
- Interactive Visualization: The resulting graph is displayed as an interactive network in your browser.
How it Works in Detail
Text Chunking
LLMs have a context window limit (and local systems also have a memory limit). To process large documents, the tool automatically splits the text into chunks (e.g., 500 words each with some overlap). Overlapping helps maintain context at boundary sentences. Each chunk is then sent to the LLM with a prompt instructing it to extract SPO triples.
LLM-Powered Extraction
For each chunk, the tool asks the LLM to output a JSON array of triples and what chunk the information what extracted from. Example below:
[
  {
    "subject": "eli whitney",
    "predicate": "invented",
    "object": "cotton gin",
    "chunk": 1
  },
  {
    "subject": "Industrial Revolution",
    "predicate": "reshapes",
    "object": "economic systems",
    "chunk": 1
  },
  {
    "subject": "amazon",
    "predicate": "transformed",
    "object": "retail",
    "chunk": 3
  }
]
The prompt encourages consistent entity naming, short relationship phrases (1–3 words), and no pronoun references. The extracted triples from all chunks are then combined into an initial raw knowledge graph.
Standardizing Entities Across Chunks
After extraction, you’ll often find many variations of the same entity (e.g., “AI,” “A.I.,” “artificial intelligence”). To avoid fragmented or duplicated nodes, the tool offers an entity standardization step.
- Basic Normalization: Lowercasing, trimming whitespace, etc., merges obvious duplicates.
- Standardization (Optional): When enabled, the LLM clusters different mentions that likely refer to the same entity. For instance, “New York,” “NYC,” and “New York City” become one canonical node, and “United States,” “U.S.,” and “USA” become another.
This improves graph coherence and is typically recommended. You can disable it in the configuration file if you need strictly raw extractions.
Inferring Hidden Connections to Enrich the Graph
Even a thorough reading of the text may not capture implied relationships. The tool addresses this in two ways:
Rule-Based Inference:
- Transitive Relationships: If A enables B, and B drives C, the system can infer A influences C.
- Lexical Similarity: Entities with similar names might be linked with a generic “related to” relationship.
LLM-Assisted Inference:
- The tool can prompt the LLM to propose links between otherwise disconnected subgraphs. For example, if one cluster is about the Industrial Revolution and another is about AI, the LLM might infer a historical or conceptual connection (“AI is an outgrowth of technological innovation that began in the Industrial Revolution”).
- These edges are marked differently (e.g., dashed lines) to distinguish them from explicitly stated facts.
This inference step often adds a large number of new relationships, greatly reducing isolated sub-networks. You can disable it in the configuration file if you want a purely text-derived graph. Rather than a chunk number, the inferred relationships include an attribute indicating that the relationship was inferred. This attribute is important as it will be used during visualization indicate inferred relationships with dashed edge lines. Example structure:
[
  {
    "subject": "electrification",
    "predicate": "enables",
    "object": "Manufacturing Automation",
    "inferred": true
  },
  {
    "subject": "tim berners-lee",
    "predicate": "expanded via internet",
    "object": "information sharing",
    "inferred": true
  }
]
The LLM Prompts
There are four prompts that are sent to the LLM if all the options are enabled. The initial Subject-Predicate-Object (SPO) knowledge extraction.
Extraction System Prompt:
You are an advanced AI system specialized in knowledge extraction and knowledge graph generation.
Your expertise includes identifying consistent entity references and meaningful relationships in text.
CRITICAL INSTRUCTION: All relationships (predicates) MUST be no more than 3 words maximum. Ideally 1-2 words. This is a hard limit.
Extraction User Prompt:
Your task: Read the text below (delimited by triple backticks) and identify all Subject-Predicate-Object (S-P-O) relationships in each sentence. Then produce a single JSON array of objects, each representing one triple.

Follow these rules carefully:

- Entity Consistency: Use consistent names for entities throughout the document. For example, if "John Smith" is mentioned as "John", "Mr. Smith", and "John Smith" in different places, use a single consistent form (preferably the most complete one) in all triples.
- Atomic Terms: Identify distinct key terms (e.g., objects, locations, organizations, acronyms, people, conditions, concepts, feelings). Avoid merging multiple ideas into one term (they should be as "atomistic" as possible).
- Unified References: Replace any pronouns (e.g., "he," "she," "it," "they," etc.) with the actual referenced entity, if identifiable.
- Pairwise Relationships: If multiple terms co-occur in the same sentence (or a short paragraph that makes them contextually related), create one triple for each pair that has a meaningful relationship.
- CRITICAL INSTRUCTION: Predicates MUST be 1-3 words maximum. Never more than 3 words. Keep them extremely concise.
- Ensure that all possible relationships are identified in the text and are captured in an S-P-O relation.
- Standardize terminology: If the same concept appears with slight variations (e.g., "artificial intelligence" and "AI"), use the most common or canonical form consistently.
- Make all the text of S-P-O text lower-case, even Names of people and places.
- If a person is mentioned by name, create a relation to their location, profession and what they are known for (invented, wrote, started, title, etc.) if known and if it fits the context of the informaiton.

Important Considerations:
- Aim for precision in entity naming - use specific forms that distinguish between similar but different entities
- Maximize connectedness by using identical entity names for the same concepts throughout the document
- Consider the entire context when identifying entity references
- ALL PREDICATES MUST BE 3 WORDS OR FEWER - this is a hard requirement

Output Requirements:

- Do not include any text or commentary outside of the JSON.
- Return only the JSON array, with each triple as an object containing "subject", "predicate", and "object".
- Make sure the JSON is valid and properly formatted.
There are three more prompts that aren’t listed here, that guide the LLM for the standardization, and relationship inferences. You can examine (and adjust) all of the prompts in the src/knowledge_graph/prompts.py source file.
Interactive Graph Visualization
With a comprehensive list of SPO triples (original plus inferred), the tool generates an interactive HTML visualization using PyVis (a Python interface to Vis.js). Opening the resulting file in your browser, you’ll see:
- Color-Coded Communities: Nodes in the same cluster share a color. Clusters often map to subtopics or themes in the text.
- Node Sizing by Importance: Nodes with many connections (or high centrality) appear larger.
- Edge Styles: Solid lines for text-derived relationships, dashed lines for inferred ones.
- Interactive Controls: Pan, zoom, drag nodes, toggle physics, switch light/dark mode, and filter the view.
This makes it easy to explore the relationships in an visually appealing format.
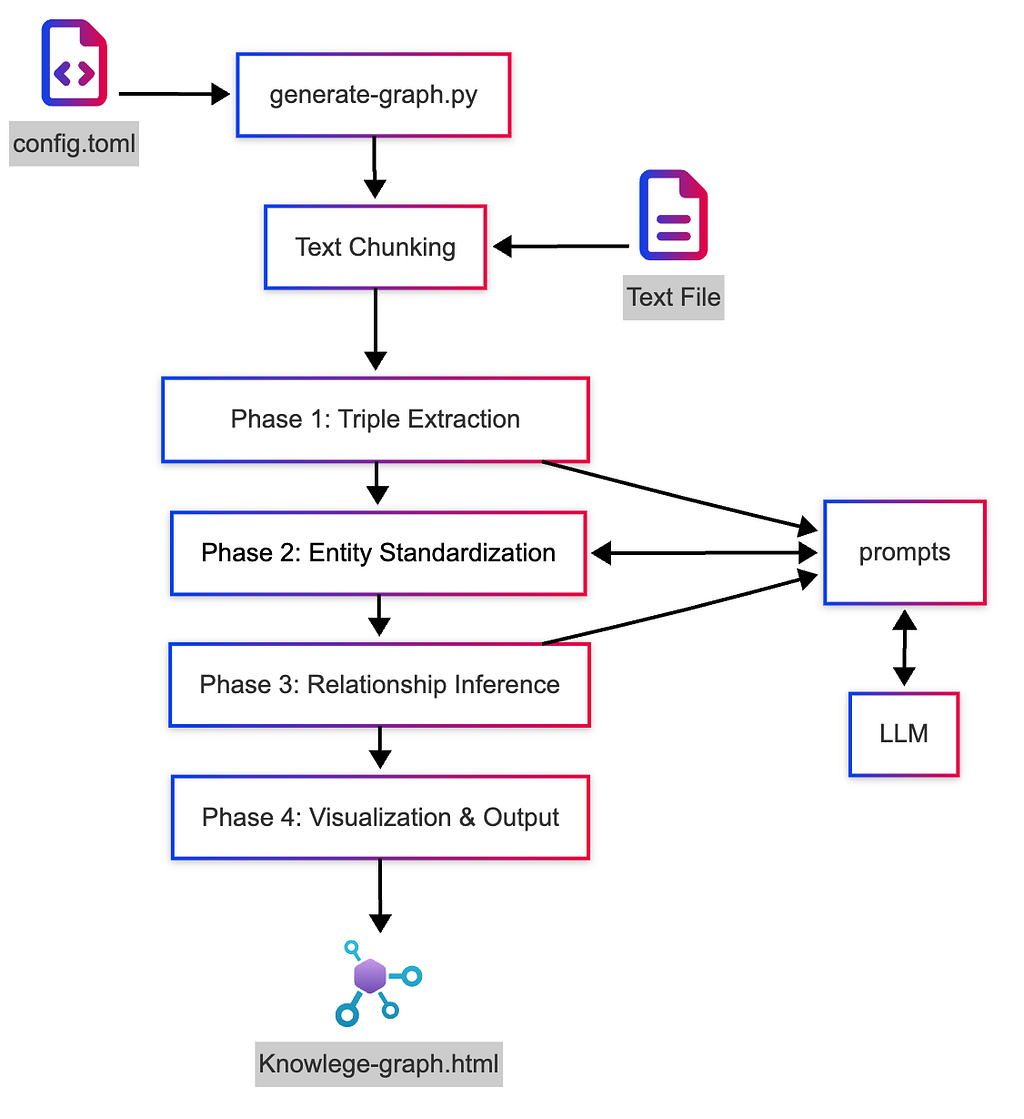
Program Flow
Below is the basic flow of the program (there is a much more detailed program flow diagram in the code repository’s README.md):
Installing AI-Knowledge-Graph
To be able to run this on your computer you will need to satisfy the following requirements:
Requirements:
- A computer to run it on (Windows, Linux or MacOS)
- Python (3.12 or higher) installed (uv recommend)
- Access to an OpenAI compatible API endpoint (Ollama, LiteLLM, LM Studio, OpenAI subscription, etc..)
- Git to clone the code repository
Downloading and installing the dependencies:
Clone the repository to the system you are going to run it on and change to that directory:
git clone https://github.com/robert-mcdermott/ai-knowledge-graph.git
cd ai-knowledge-graph
Install the dependancies with uv:
uv sync
Or install with pip:
pip install -r requirements.txt
Configuring AI-Knowledge-Graph
Edit the config.toml file to adjust to your situation. This is where you configure the LLM model, endpoint (url), max content window length and temperature for your LLM. In the example below I’m using Google’s open Gemma 3 model hosted on my local computer using Ollama. This is where you can also adjust the document chunking size and overlap, as well if you want to use also standardize the entities and use inference to establish more relationships:
[llm]
model = "gemma3"
api_key = "sk-1234"
base_url = "http://localhost:11434/v1/chat/completions"
max_tokens = 8192
temperature = 0.2

[chunking]
chunk_size = 200  # Number of words per chunk
overlap = 20      # Number of words to overlap between chunks

[standardization]
enabled = true               # Whether to enable entity standardization
use_llm_for_entities = true  # Whether to use LLM for additional entity resolution

[inference]
enabled = true                # Whether to enable relationship inference
use_llm_for_inference = true  # Whether to use LLM for relationship inference
apply_transitive = true       # Whether to apply transitive inference rules

[visualization]
edge_smooth = false  # Smooth edge lines true or false
Note: for your local LLM use, you can use Ollama or LM Studio API endpoint and for accessing any commercial LLM provider (AWS Bedrock, Azure, Anthropic, OpenAI, any many others using LiteLLM). If you need help with either running Ollama local, or LiteLLM to access other LLM services, see my previous articles: LLM Zero-to-Hero with Ollama, or Centralizing Multiple AI Services with LiteLLM Proxy.
Creating Knowledge Graphs
Now that you have ai-knowledge-graph installed and configured to point at your LLM, you are ready to create your first knowledge graph. Acquire a plain text document (it currently only works with text documents) that you want to create a knowledge graph of.
Next you’ll need to run the generate-graph.py script. Here is the help message for the script:
usage: generate-graph.py [-h] [--test] [--config CONFIG] [--output OUTPUT] [--input INPUT] [--debug] [--no-standardize] [--no-inference]

Knowledge Graph Generator and Visualizer

options:
  -h, --help        show this help message and exit
  --test            Generate a test visualization with sample data
  --config CONFIG   Path to configuration file
  --output OUTPUT   Output HTML file path
  --input INPUT     Path to input text file (required unless --test is used)
  --debug           Enable debug output (raw LLM responses and extracted JSON)
  --no-standardize  Disable entity standardization
  --no-inference    Disable relationship inference
Here’s an example creating a knowledge graph using a text document names mydocument.txt in the current directory (substitute “python” with “uv run” if you are using uv):
python generate-graph.py --input mydocument.txt --output mydocument.html
Here’s the output seen in the console for the complete pipeline run of the above command:
python generate-graph.py --input mydocument.txt --output mydocument.html
Using input text from file: mydocument.txt
==================================================
PHASE 1: INITIAL TRIPLE EXTRACTION
==================================================
Processing text in 3 chunks (size: 500 words, overlap: 50 words)
Processing chunk 1/3 (500 words)
Processing chunk 2/3 (500 words)
Processing chunk 3/3 (66 words)

Extracted a total of 73 triples from all chunks

==================================================
PHASE 2: ENTITY STANDARDIZATION
==================================================
Starting with 73 triples and 106 unique entities
Standardizing entity names across all triples...
Applied LLM-based entity standardization for 15 entity groups
Removed 8 self-referencing triples
Standardized 106 entities into 101 standard forms
After standardization: 65 triples and 72 unique entities

==================================================
PHASE 3: RELATIONSHIP INFERENCE
==================================================
Starting with 65 triples
Top 5 relationship types before inference:
  - pioneered: 9 occurrences
  - invented: 7 occurrences
  - developed: 6 occurrences
  - develops: 6 occurrences
  - was: 4 occurrences

Inferring additional relationships between entities...
Identified 18 disconnected communities in the graph
Inferred 27 new relationships between communities
Inferred 30 new relationships between communities
Inferred 6 new relationships within communities
Inferred 8 relationships based on lexical similarity
Added 51 inferred relationships

Top 5 relationship types after inference:
  - invented: 7 occurrences
  - pioneered: 6 occurrences
  - developed: 6 occurrences
  - develops: 6 occurrences
  - related to: 6 occurrences

Added 57 inferred relationships
Final knowledge graph: 116 triples
Saved raw knowledge graph data to mydocument.json
Processing 116 triples for visualization
Found 72 unique nodes
Found 55 inferred relationships
Detected 12 communities using Louvain method

Knowledge graph visualization saved to mydocument.html

Knowledge Graph Statistics:
Nodes: 72
Edges: 116 (55 inferred)
Communities: 12

To view the visualization, open the following file in your browser:
file:///Users/robertm/mycode/ai-knowledge-graph/mydocument.html
Now open the resulting html file in your web browser to explore the knowledge graph. If you are just reading along and want see and interact with a knowledge graph created by this system without creating it yourself, click the following link to see an example visualization created from a document about the industrial revolutions: Industrial-Revolutions.html
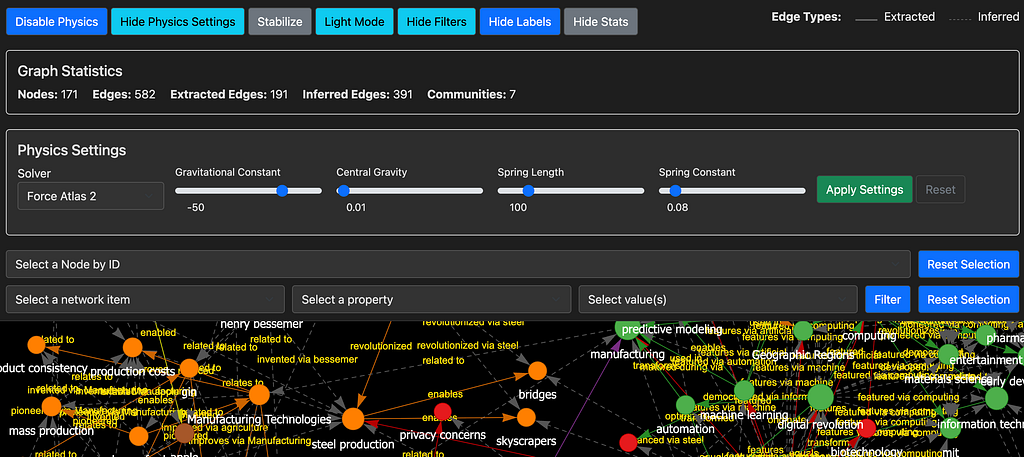
You can then use the menus at the top of the page to expand control panels to adjust the layout physics, hide or show the node/edge labels, see the graph statistics or select/filter nodes and edges. There’s also a dark mode as shown in the example below:
Experimenting with different settings is important
It’s a good idea experimenting with difference chunk/overlap sizes and LLM models to see what difference it makes. I typically set the overlap to be 10% the chunk size. Smaller document chunking sizes (100–200) seem to be able to extract more relationships than larger chunk sizes, but that may result in less relationships between other things and concepts/communities that are fragments accross small chunks. You’ll need to experiment to find the right chunk size and model. I’m also sure that there are plenty of optimizations that can be made by adjusting the prompts as well.
🤗 Thanks for reading
🐞 Update: There was a bug reported that would result in an error/crash on Windows systems when attempting to write the html file if there was some characters that the Windows default encoding scheme (not fully UTF-8 compatible) didn’t support. The resulting error was “Error saving or modifying HTML file: ‘charmap’ codec can’t encode characters in position…”. Thanks to information provided my users, I was able to fix this issue. The latest version of the code in the code repo addresses this problem.
python, network-visualization, llm, knowledge-graph, artificial-intelligence
Author
[crypto-donation-box type=”tabular” show-coin=”all”]